Generate beautiful plots in R without having to remember complicated syntax
chartql Documentation
Description
ChartQL uses a very simple syntax for the user to specify what kind of plot(s) they want to generate without having to remember complicated syntax. The ChartQL library uses ggplot2 and manages all the syntax complexities internally. As an example, to generate a bar chart of company sales faceted by product category further faceted by season of the year, we simply write:
CHART bar X category, season Y sales
Usage
cql (source_frame, cql_string)
| Parameter | Description |
|---|---|
| source_frame | DataFrame object. Used as the source to build the plot. |
| cql_string | ChartQL query string. Used to specify options in terms of how to build the plot. This includes the type of plot, choice of x and y variables, axis titles and more. Full parameter list below. |
Details
The ChartQL query language uses a fairly simple format to let users generate amazing plots but with minimal scripting, allowing for much faster prototyping. The ChartQL string uses the following general format:
CHART <chart_type> X <x_var> Y <y_var> (Options) <options>
The main variables that are required for all types of plots are:
| Prefix | Argument | Description |
|---|---|---|
| Chart | <chart_type> | bar | scatter | hist | line |
| X | <x_var>, (<x_facet>) | X-axis variable. May include a second categorical variable (comma separated) |
| Y | y_var | Y-axis variable. *Not used for hist. |
Optional Variables
All optional variable values must be enclosed in single-quotes.
| Prefix | Argument | Description |
|---|---|---|
| X_label | ‘<xlab>’ | X-axis custom label. Defaults to <x_var> |
| Y_label | ‘<ylab>’ | Y-axis custom label. Defaults to <y_var> |
| Legend | ‘<legend>’ | Legend custom label. Defaults to <x_category> |
| Colorset | ‘<clist>’ | Custom set of colors for <x_category> levels. Must be comma-separated list. |
| AggFunc | ‘<func>’ | Summary function for bar type. Valid types: mean | median | count | sumDefaults to mean. |
| Fit | ‘<show_se>’ | Valid types: true | false. Fit linear line. |
| ConfInt | ‘<interval>’ | Show error bars. Value is confidence interval value. E.g. ‘.95’ |
Examples
# Test data
dframe <- mtcars
# transform to categorical
dframe$cyl <- factor(dframe$cyl);
dframe$am <- factor(dframe$am);
dframe$vs <- factor(dframe$vs);
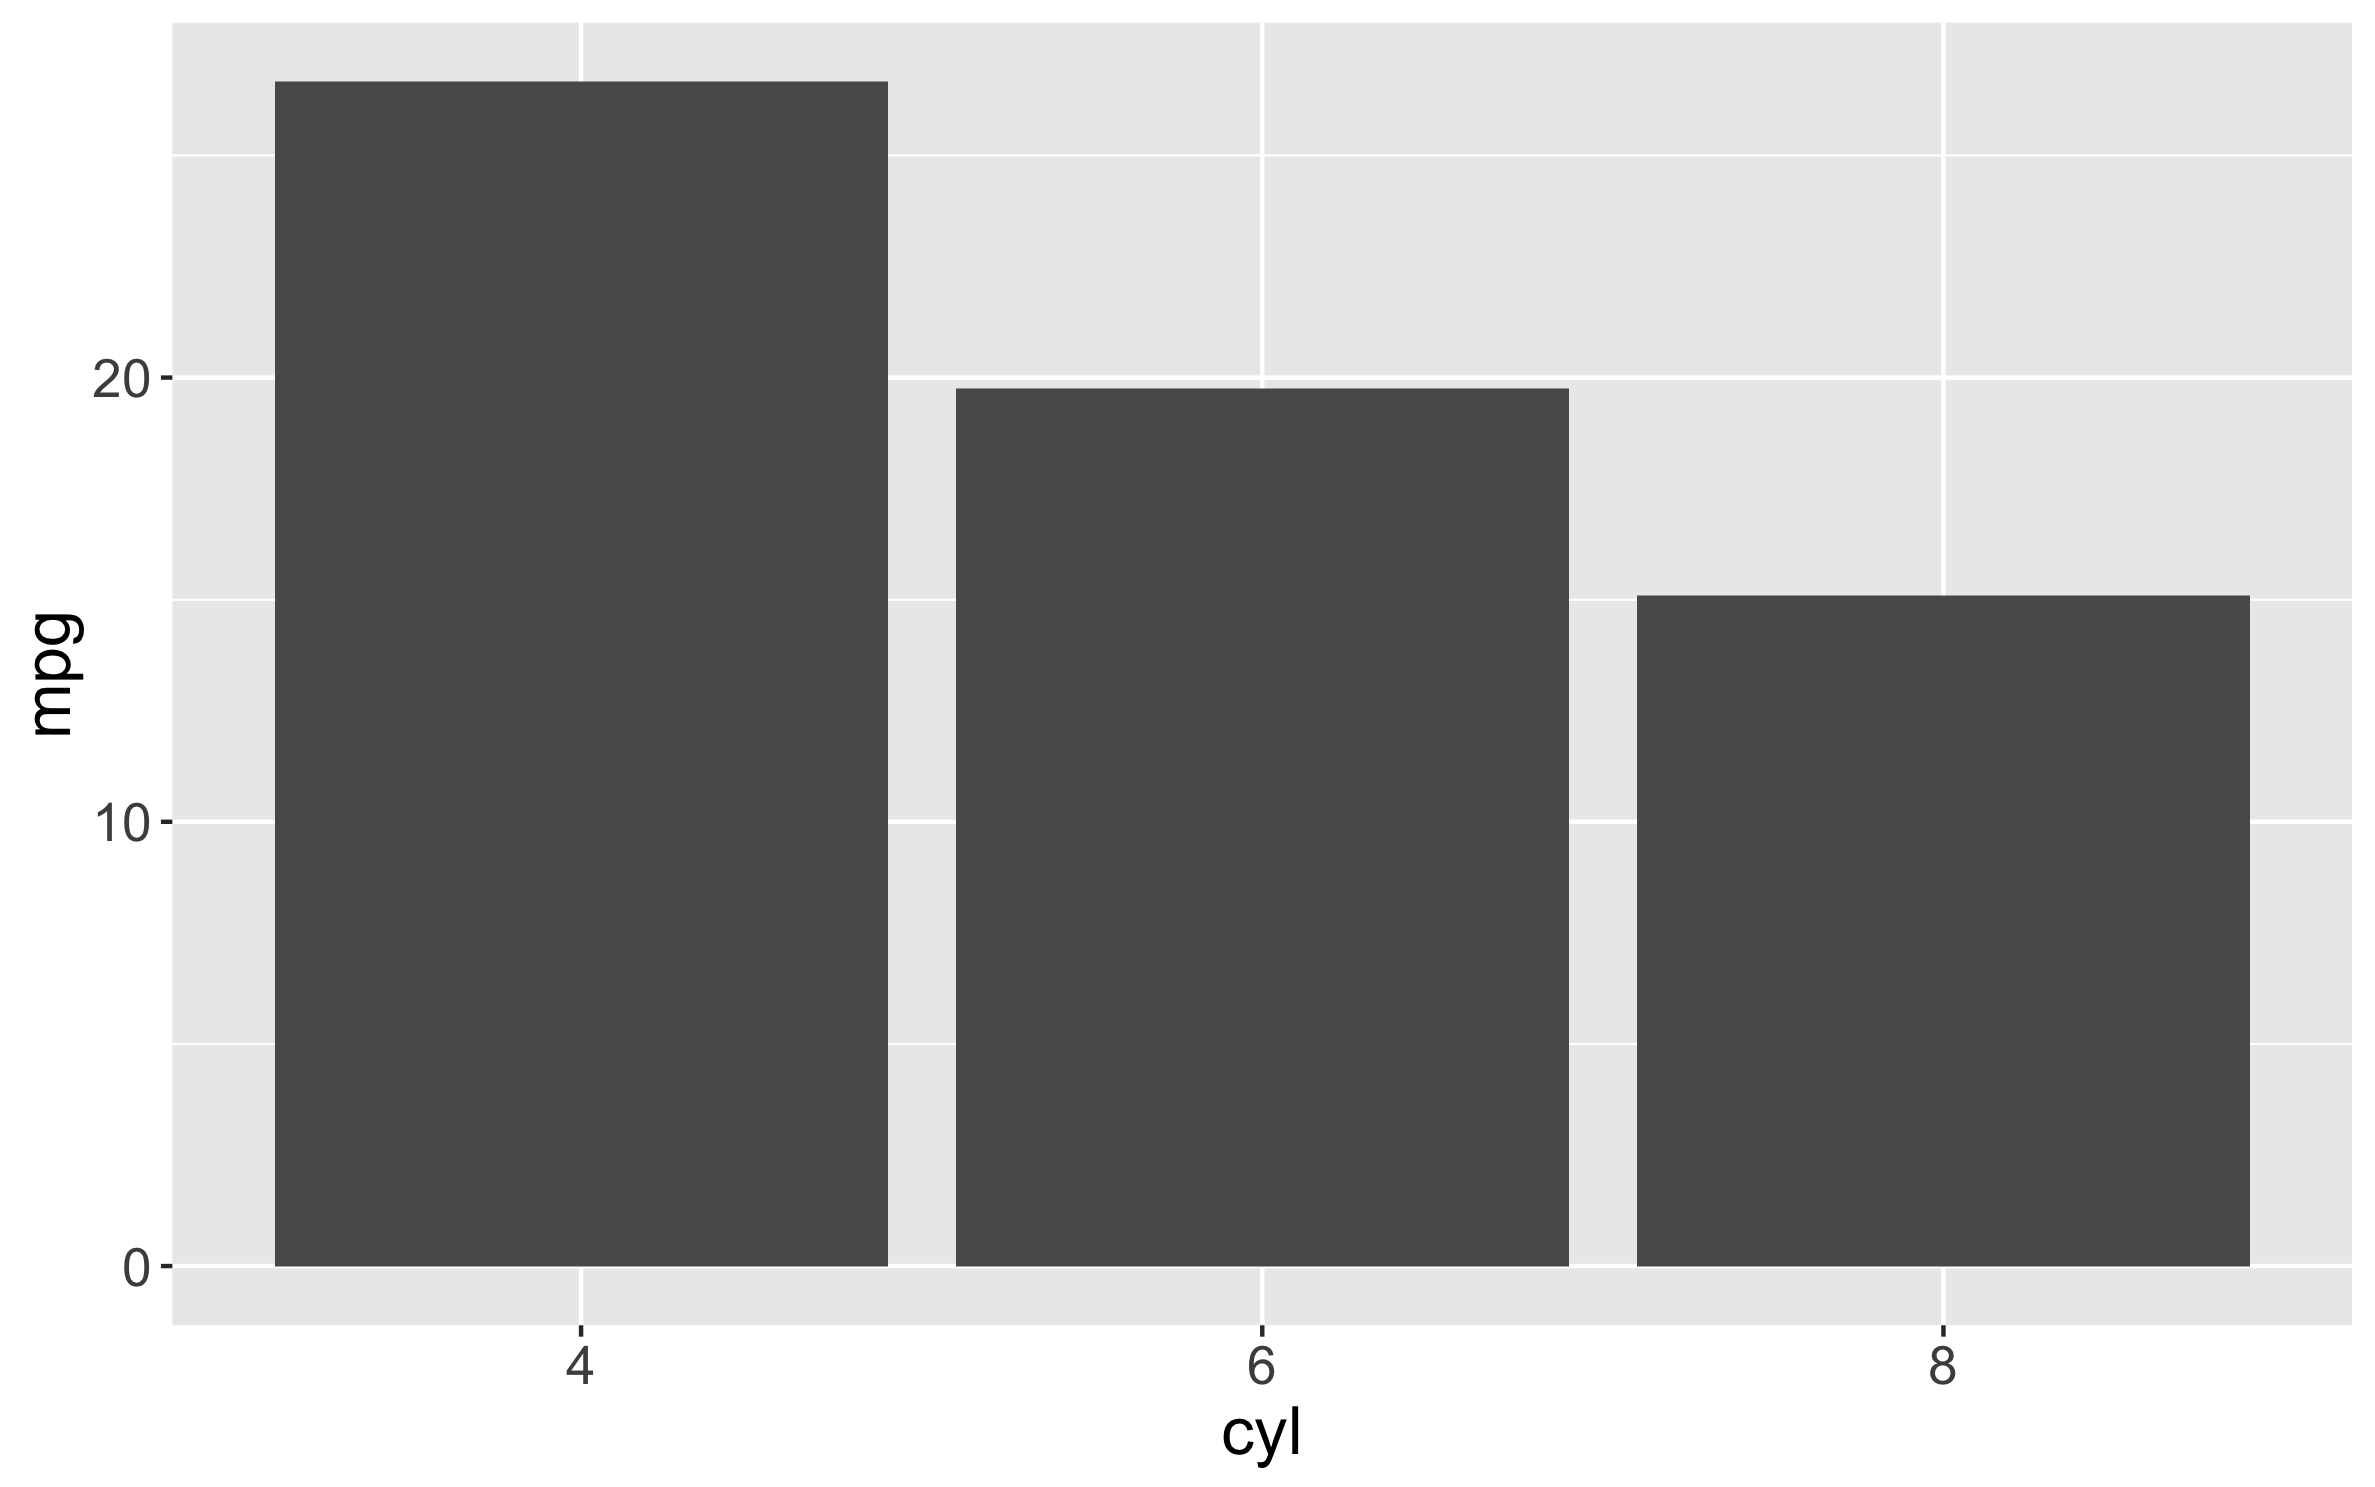
# Bar chart with number of cylinders on X and mpg value on Y. Default aggregation by mean:
cql_str <- "CHART bar X cyl Y mpg";
cql(dframe, cql_str);
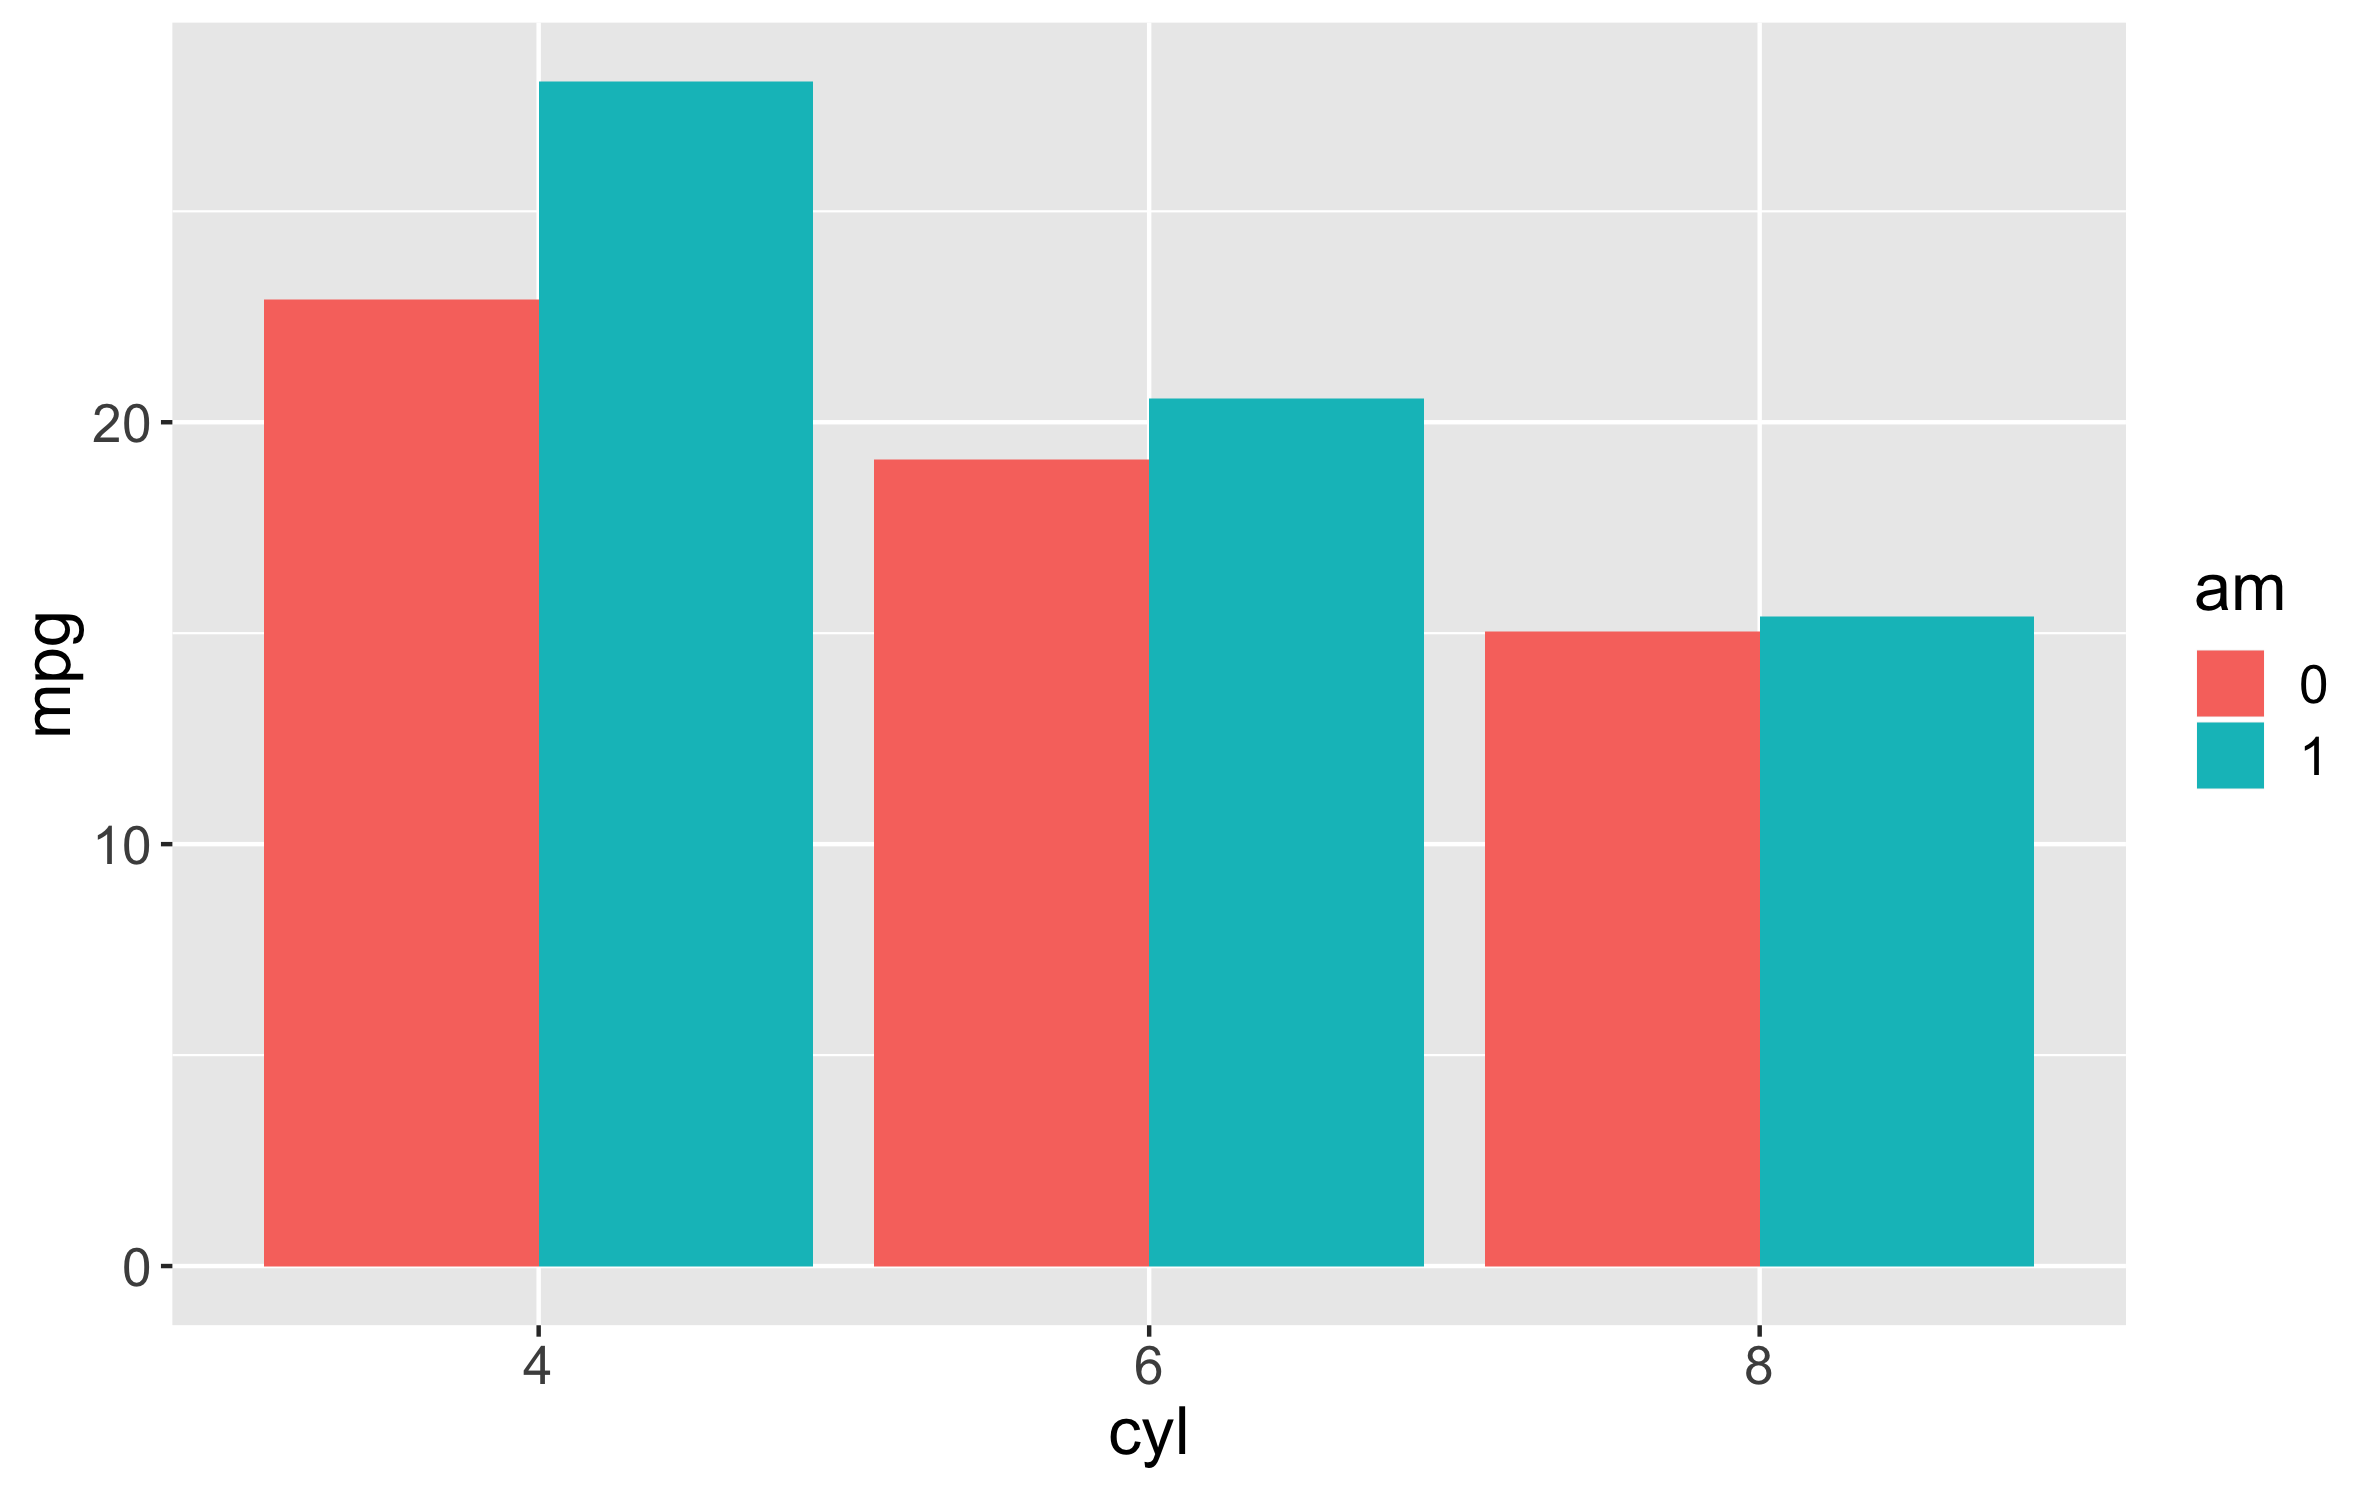
# Same as above but faceting unique number of cylinders by am (auto vs manual):
cql_str <- "CHART bar X cyl, am Y mpg";
cql(dframe, cql_str);
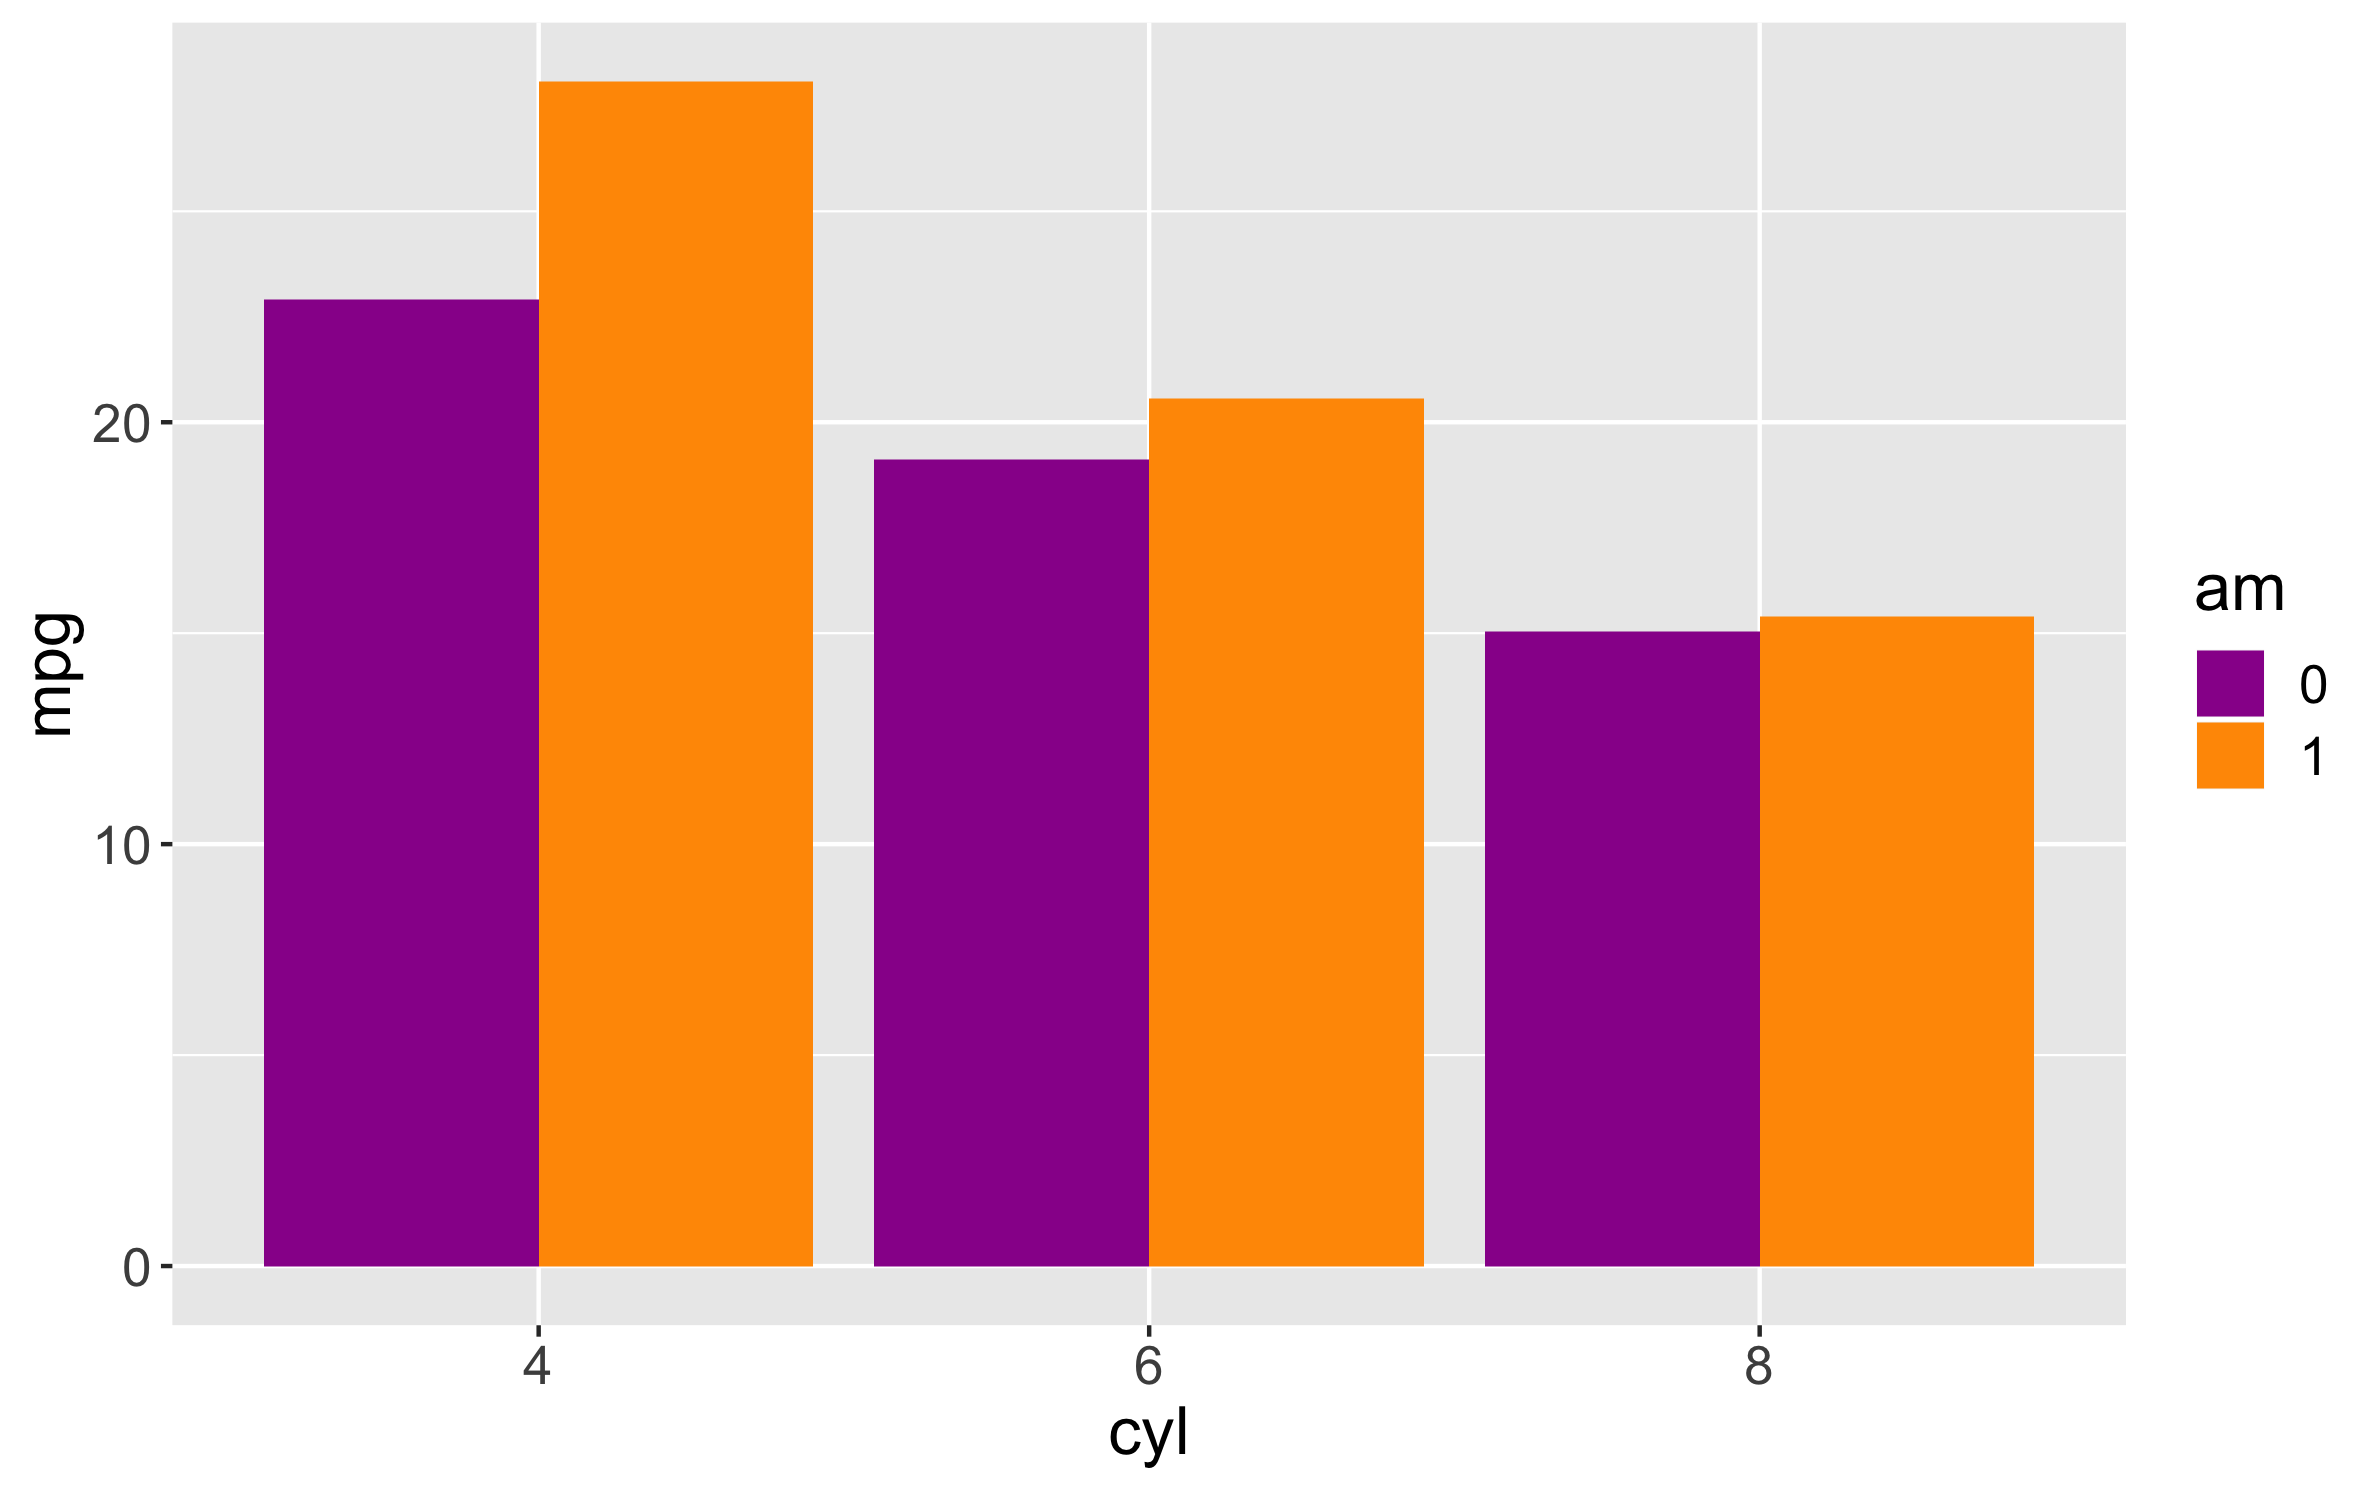
# Bar chart with am color-coded purple vs orange:
cql_str <- "CHART bar X cyl, am Y mpg Colorset '#990099, #FF9900'";
cql(dframe, cql_str);
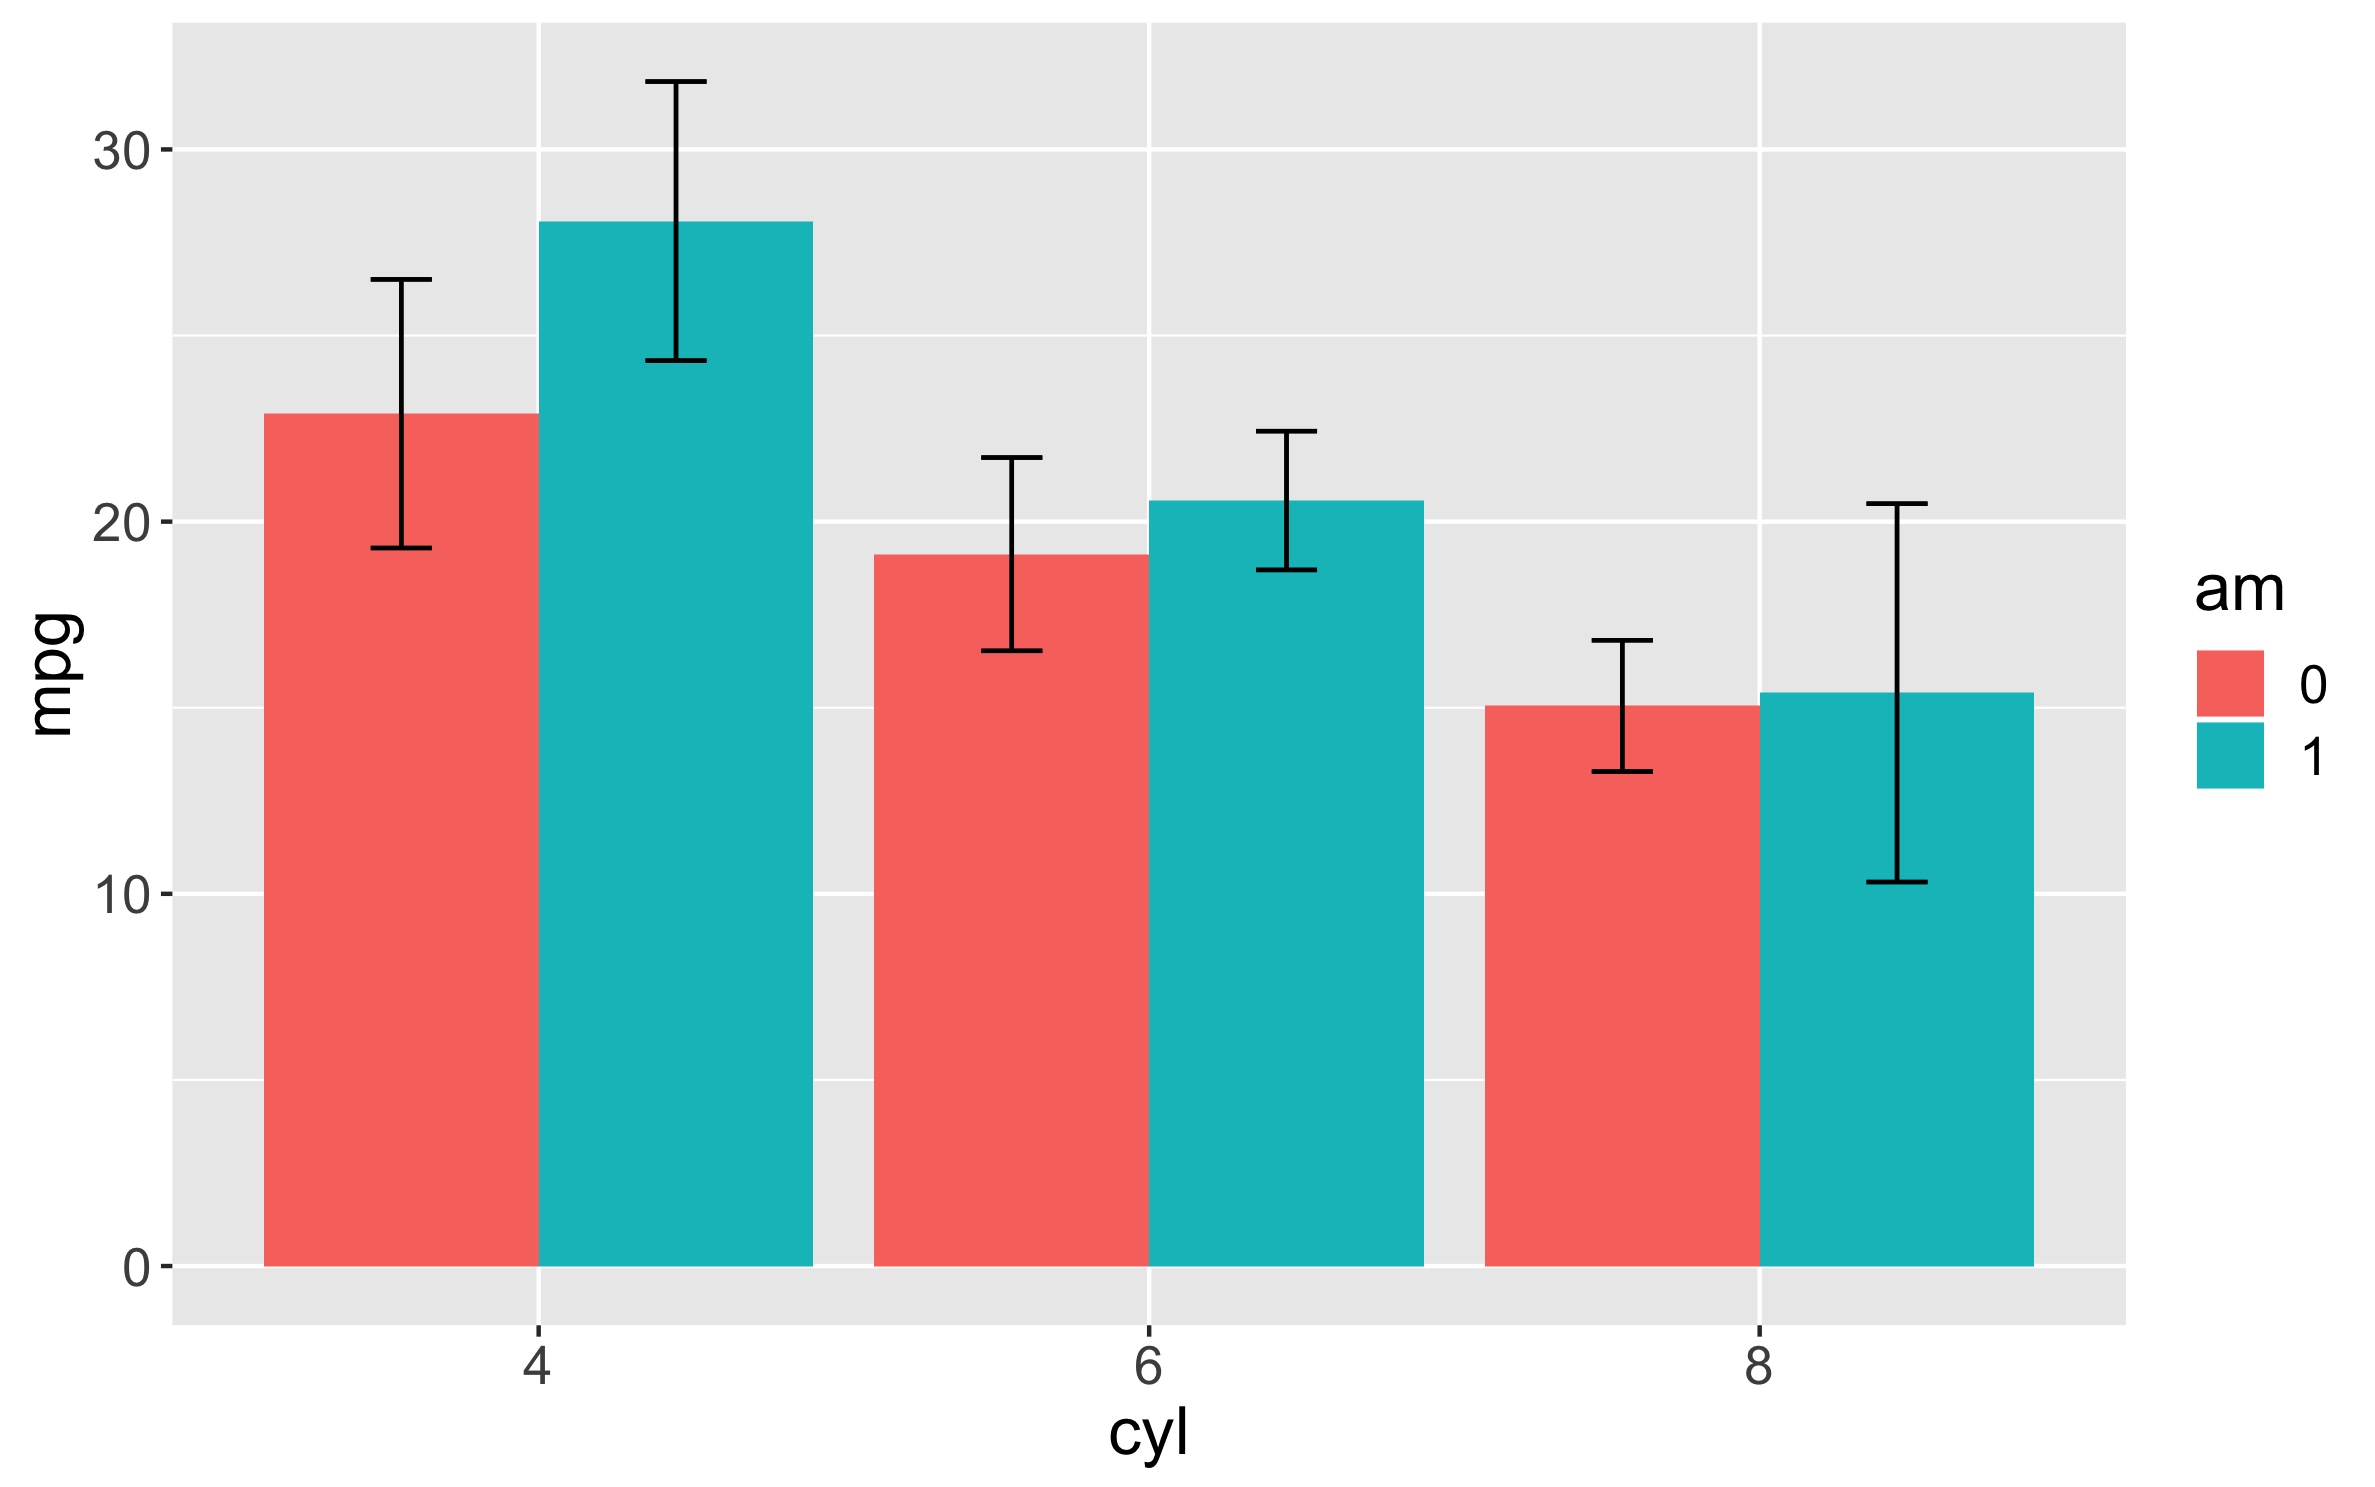
# Bar chart with 95% confidence error bars
cql_str <- "CHART bar X cyl, am Y mpg ConfInt '.95'";
cql(dframe, cql_str);
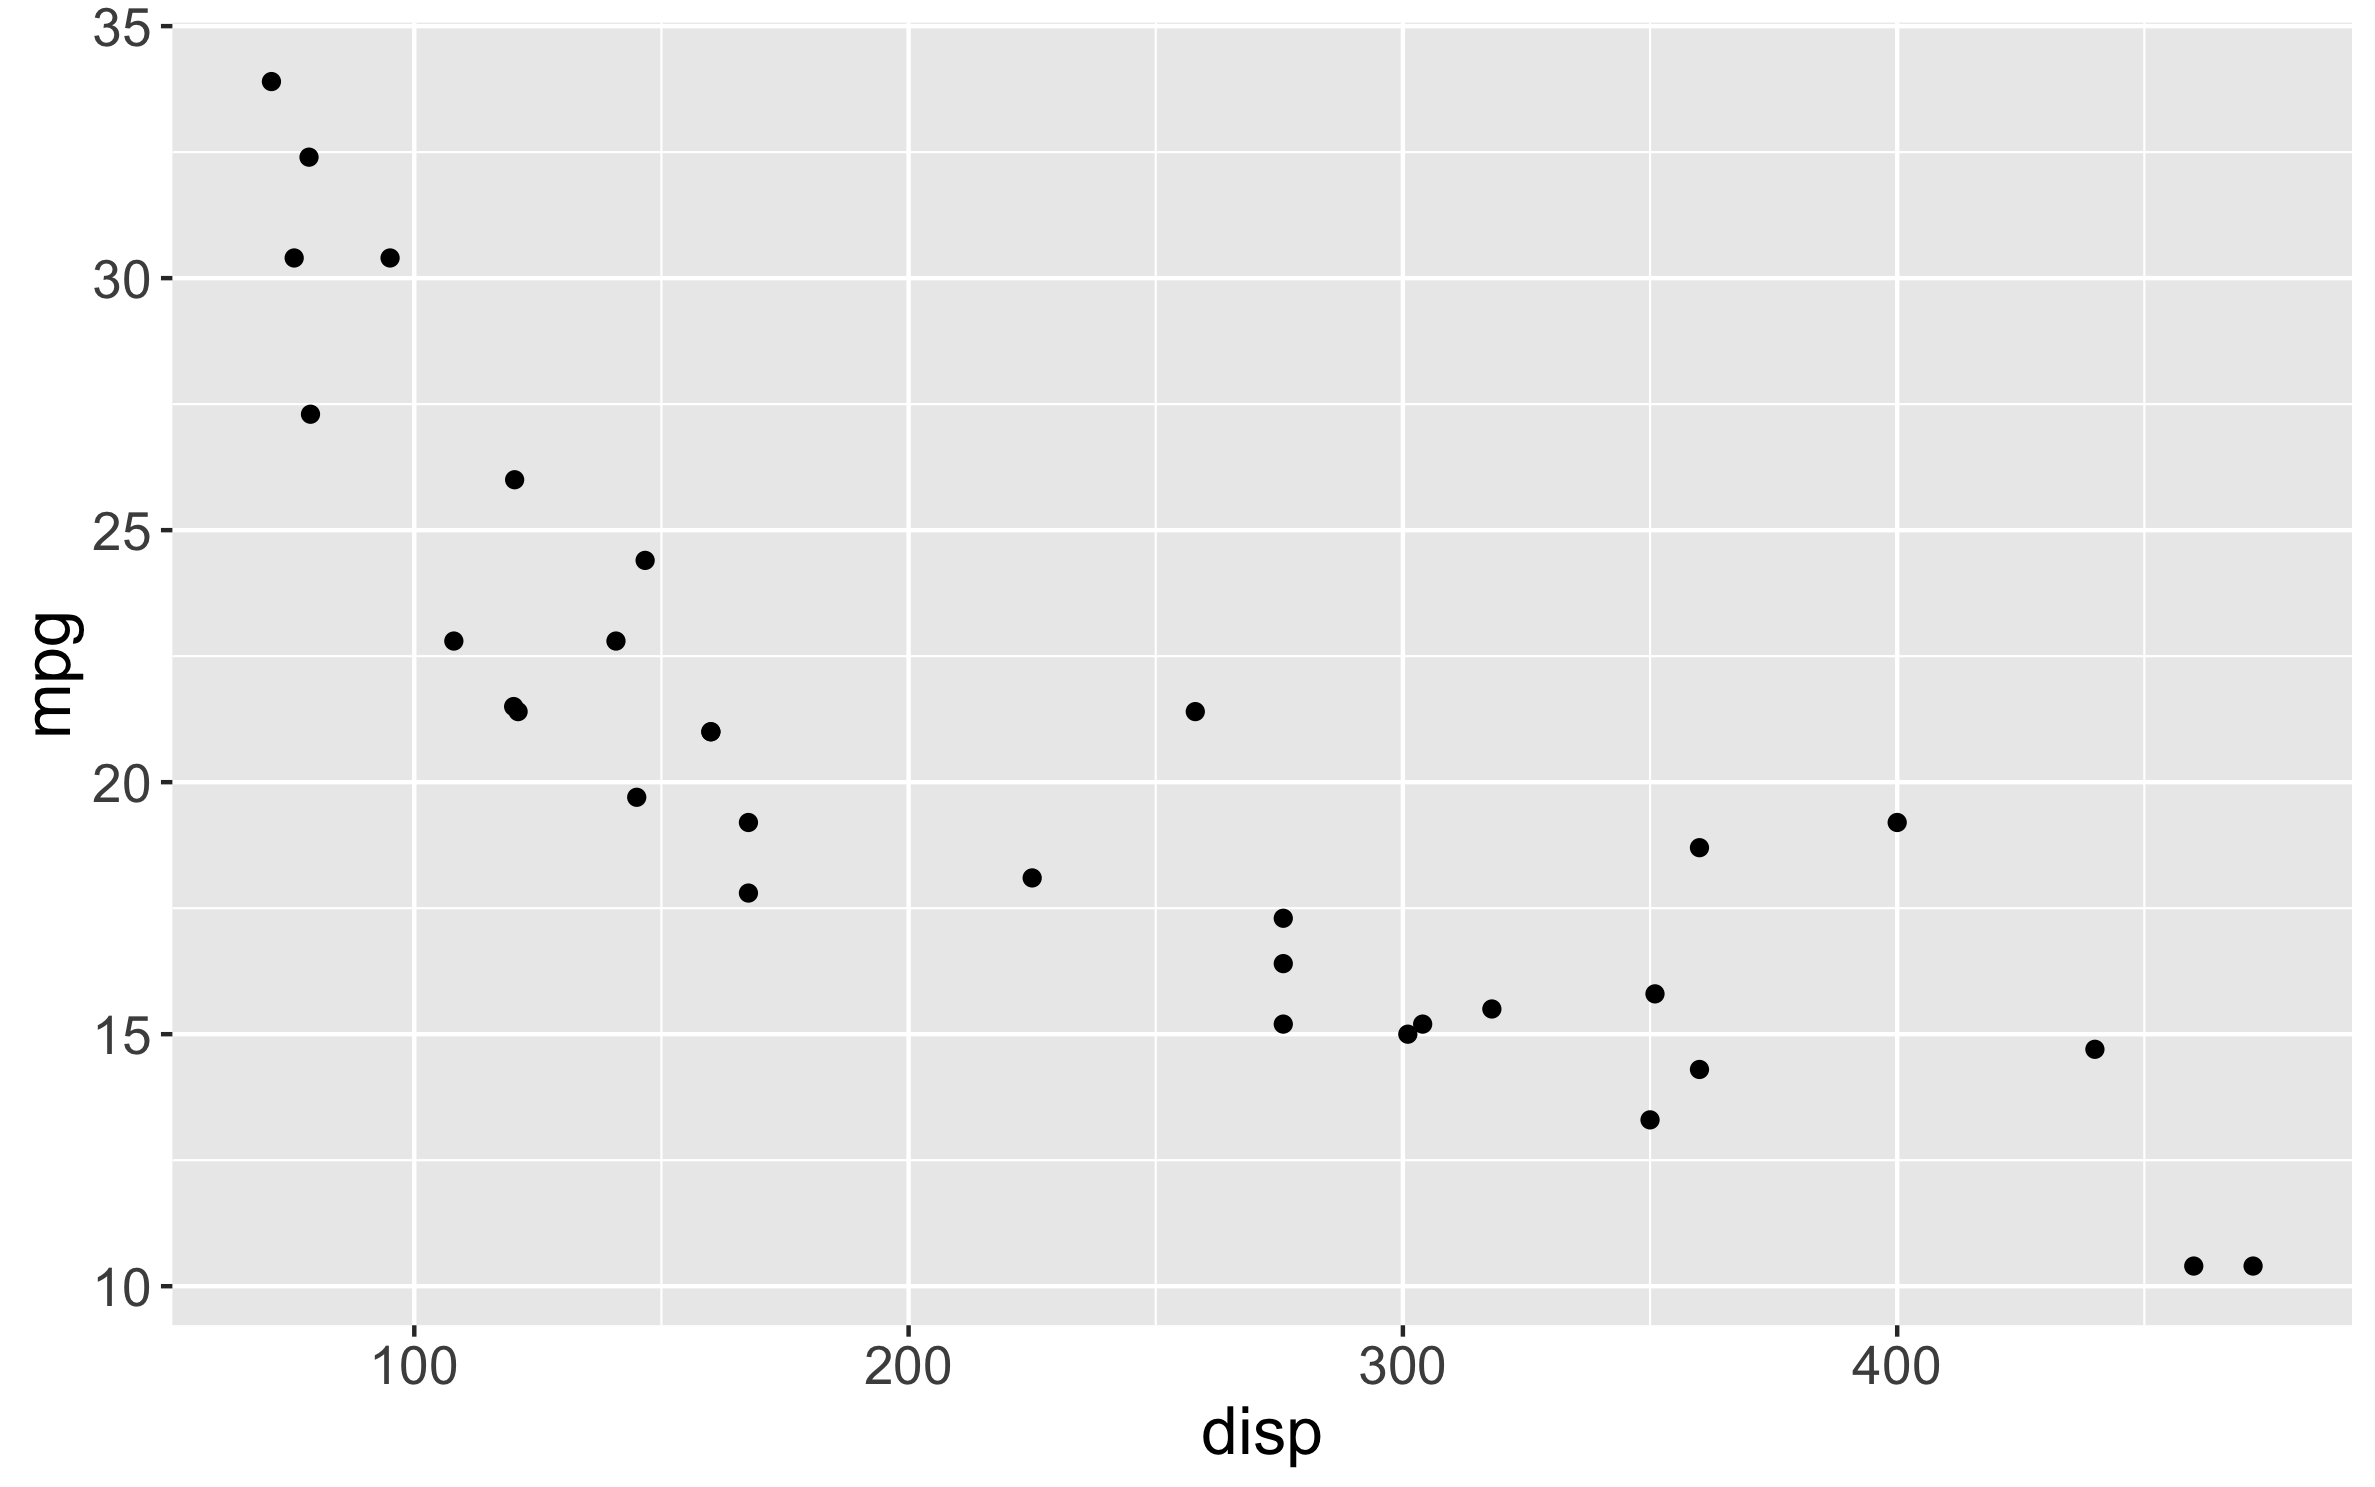
# Scatter plot of displacement vs mpg
cql_str <- "CHART scatter X disp Y mpg";
cql(dframe, cql_str);
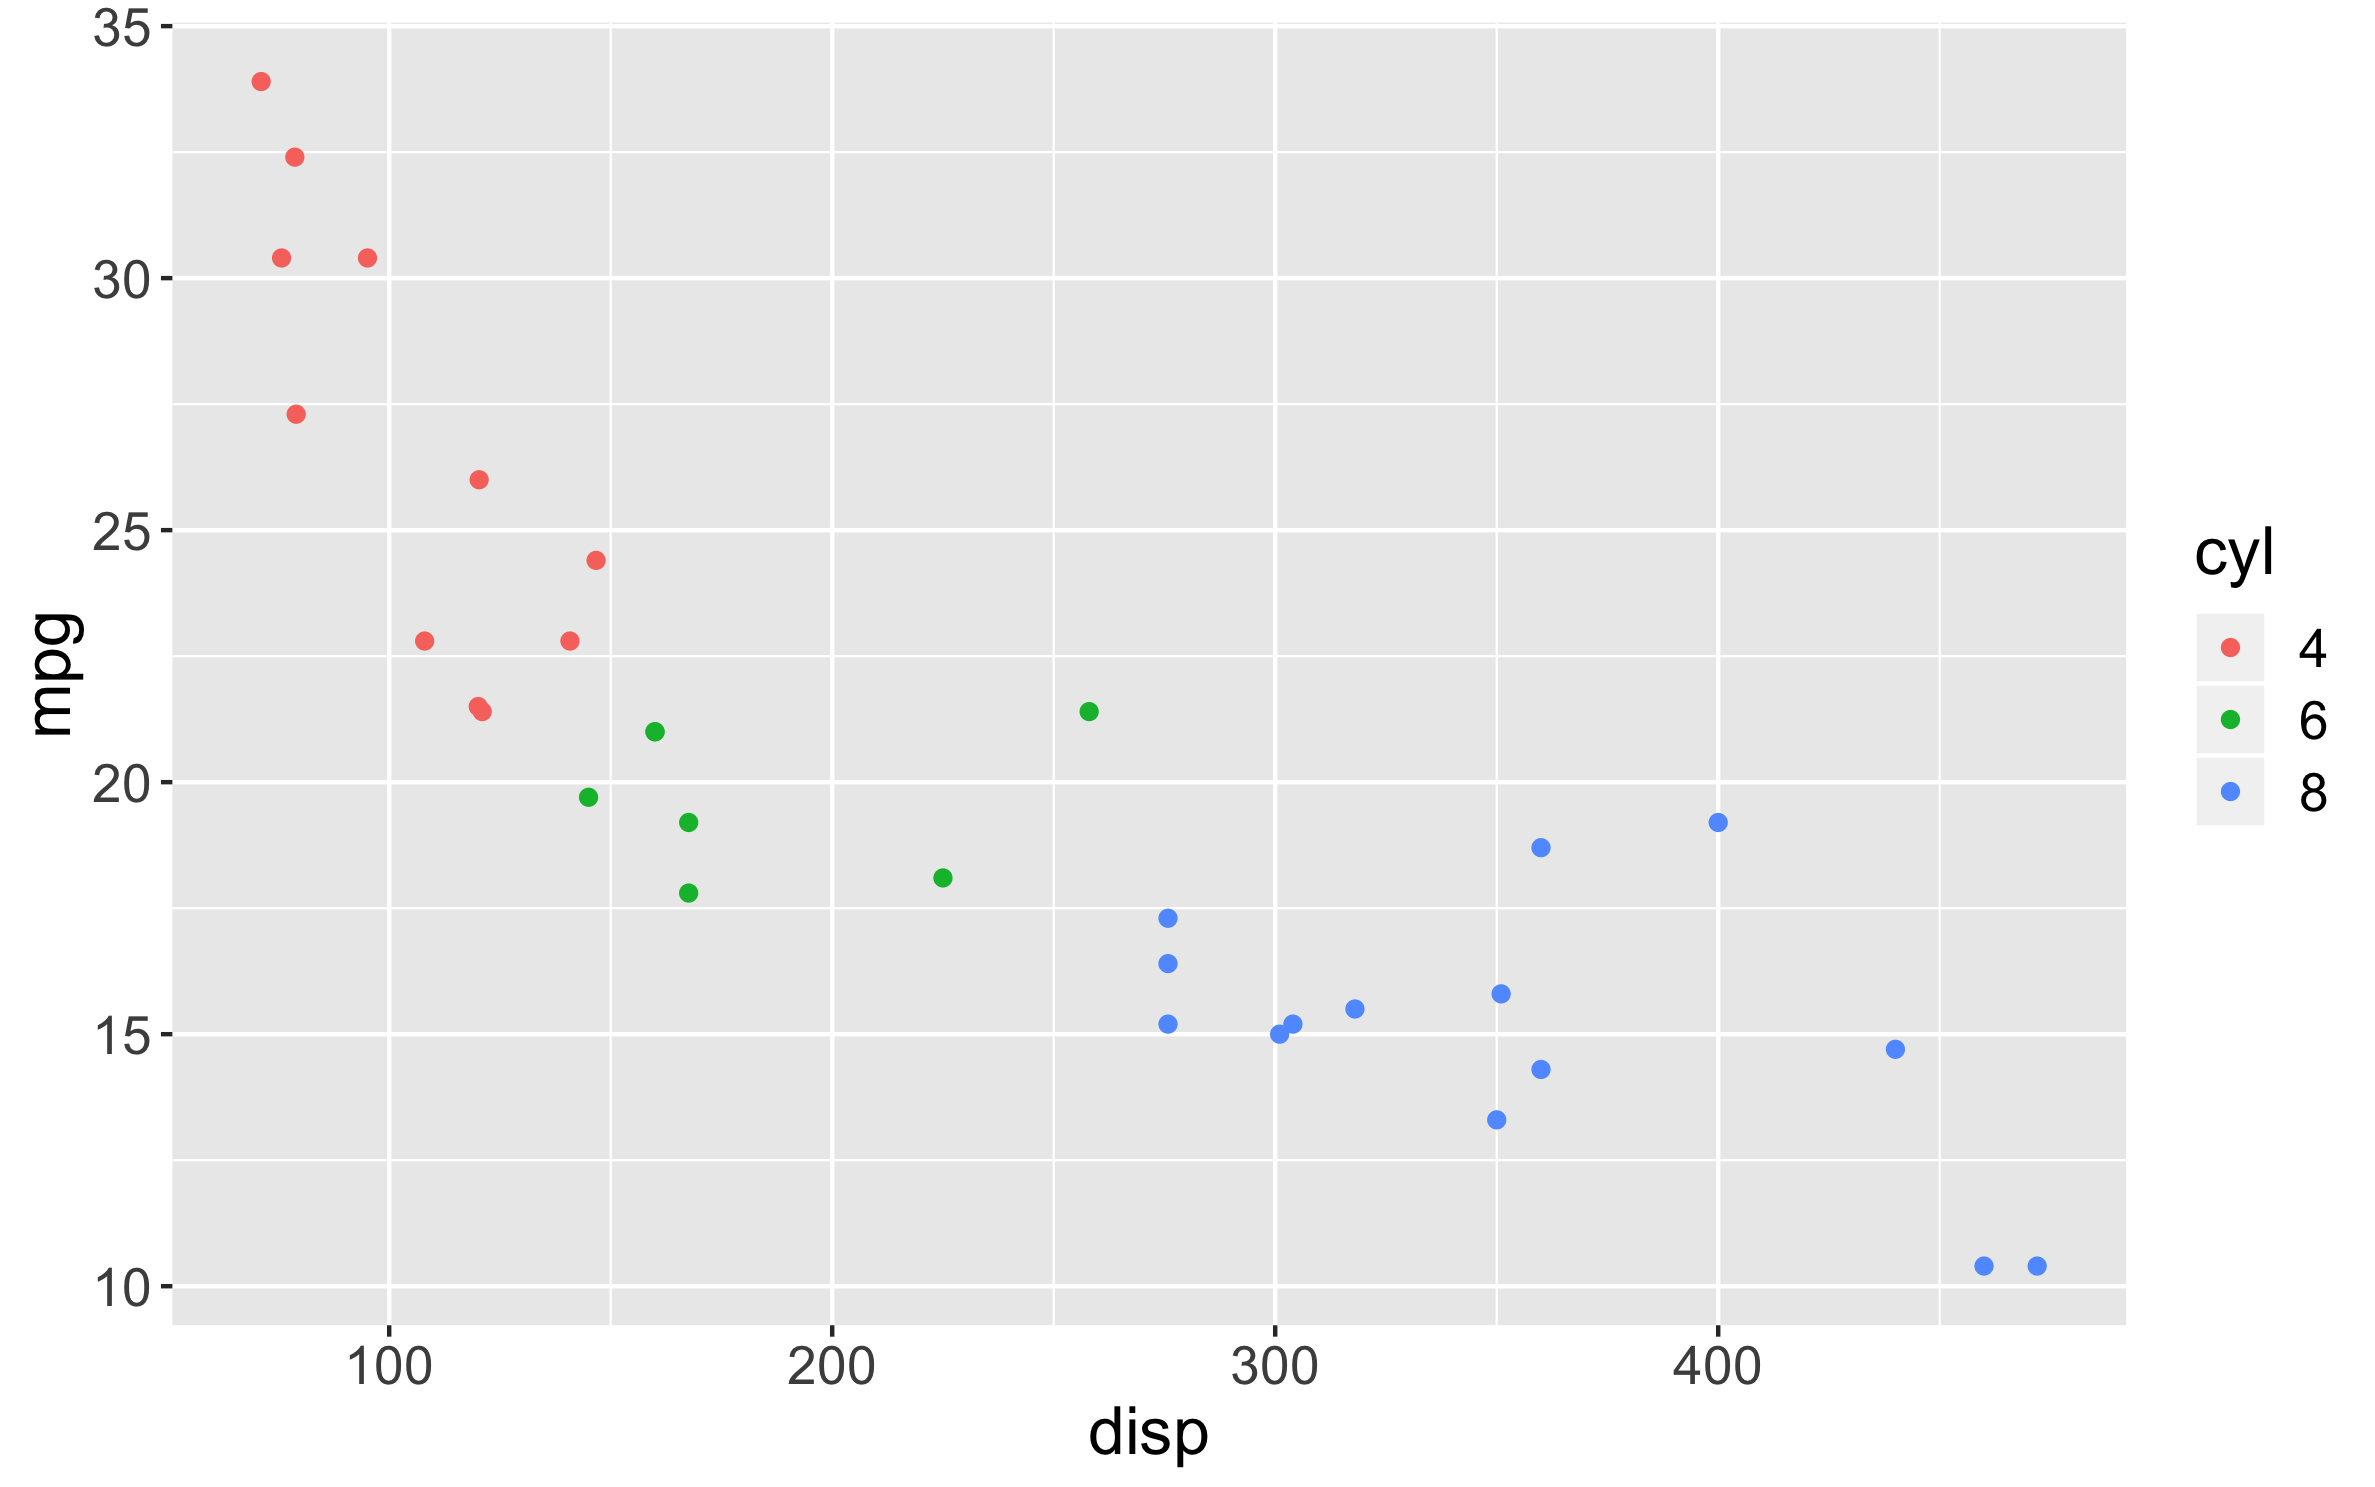
# Scatter plot faceted by number of cylinders
cql_str <- "CHART scatter X disp, cyl Y mpg";
cql(dframe, cql_str);
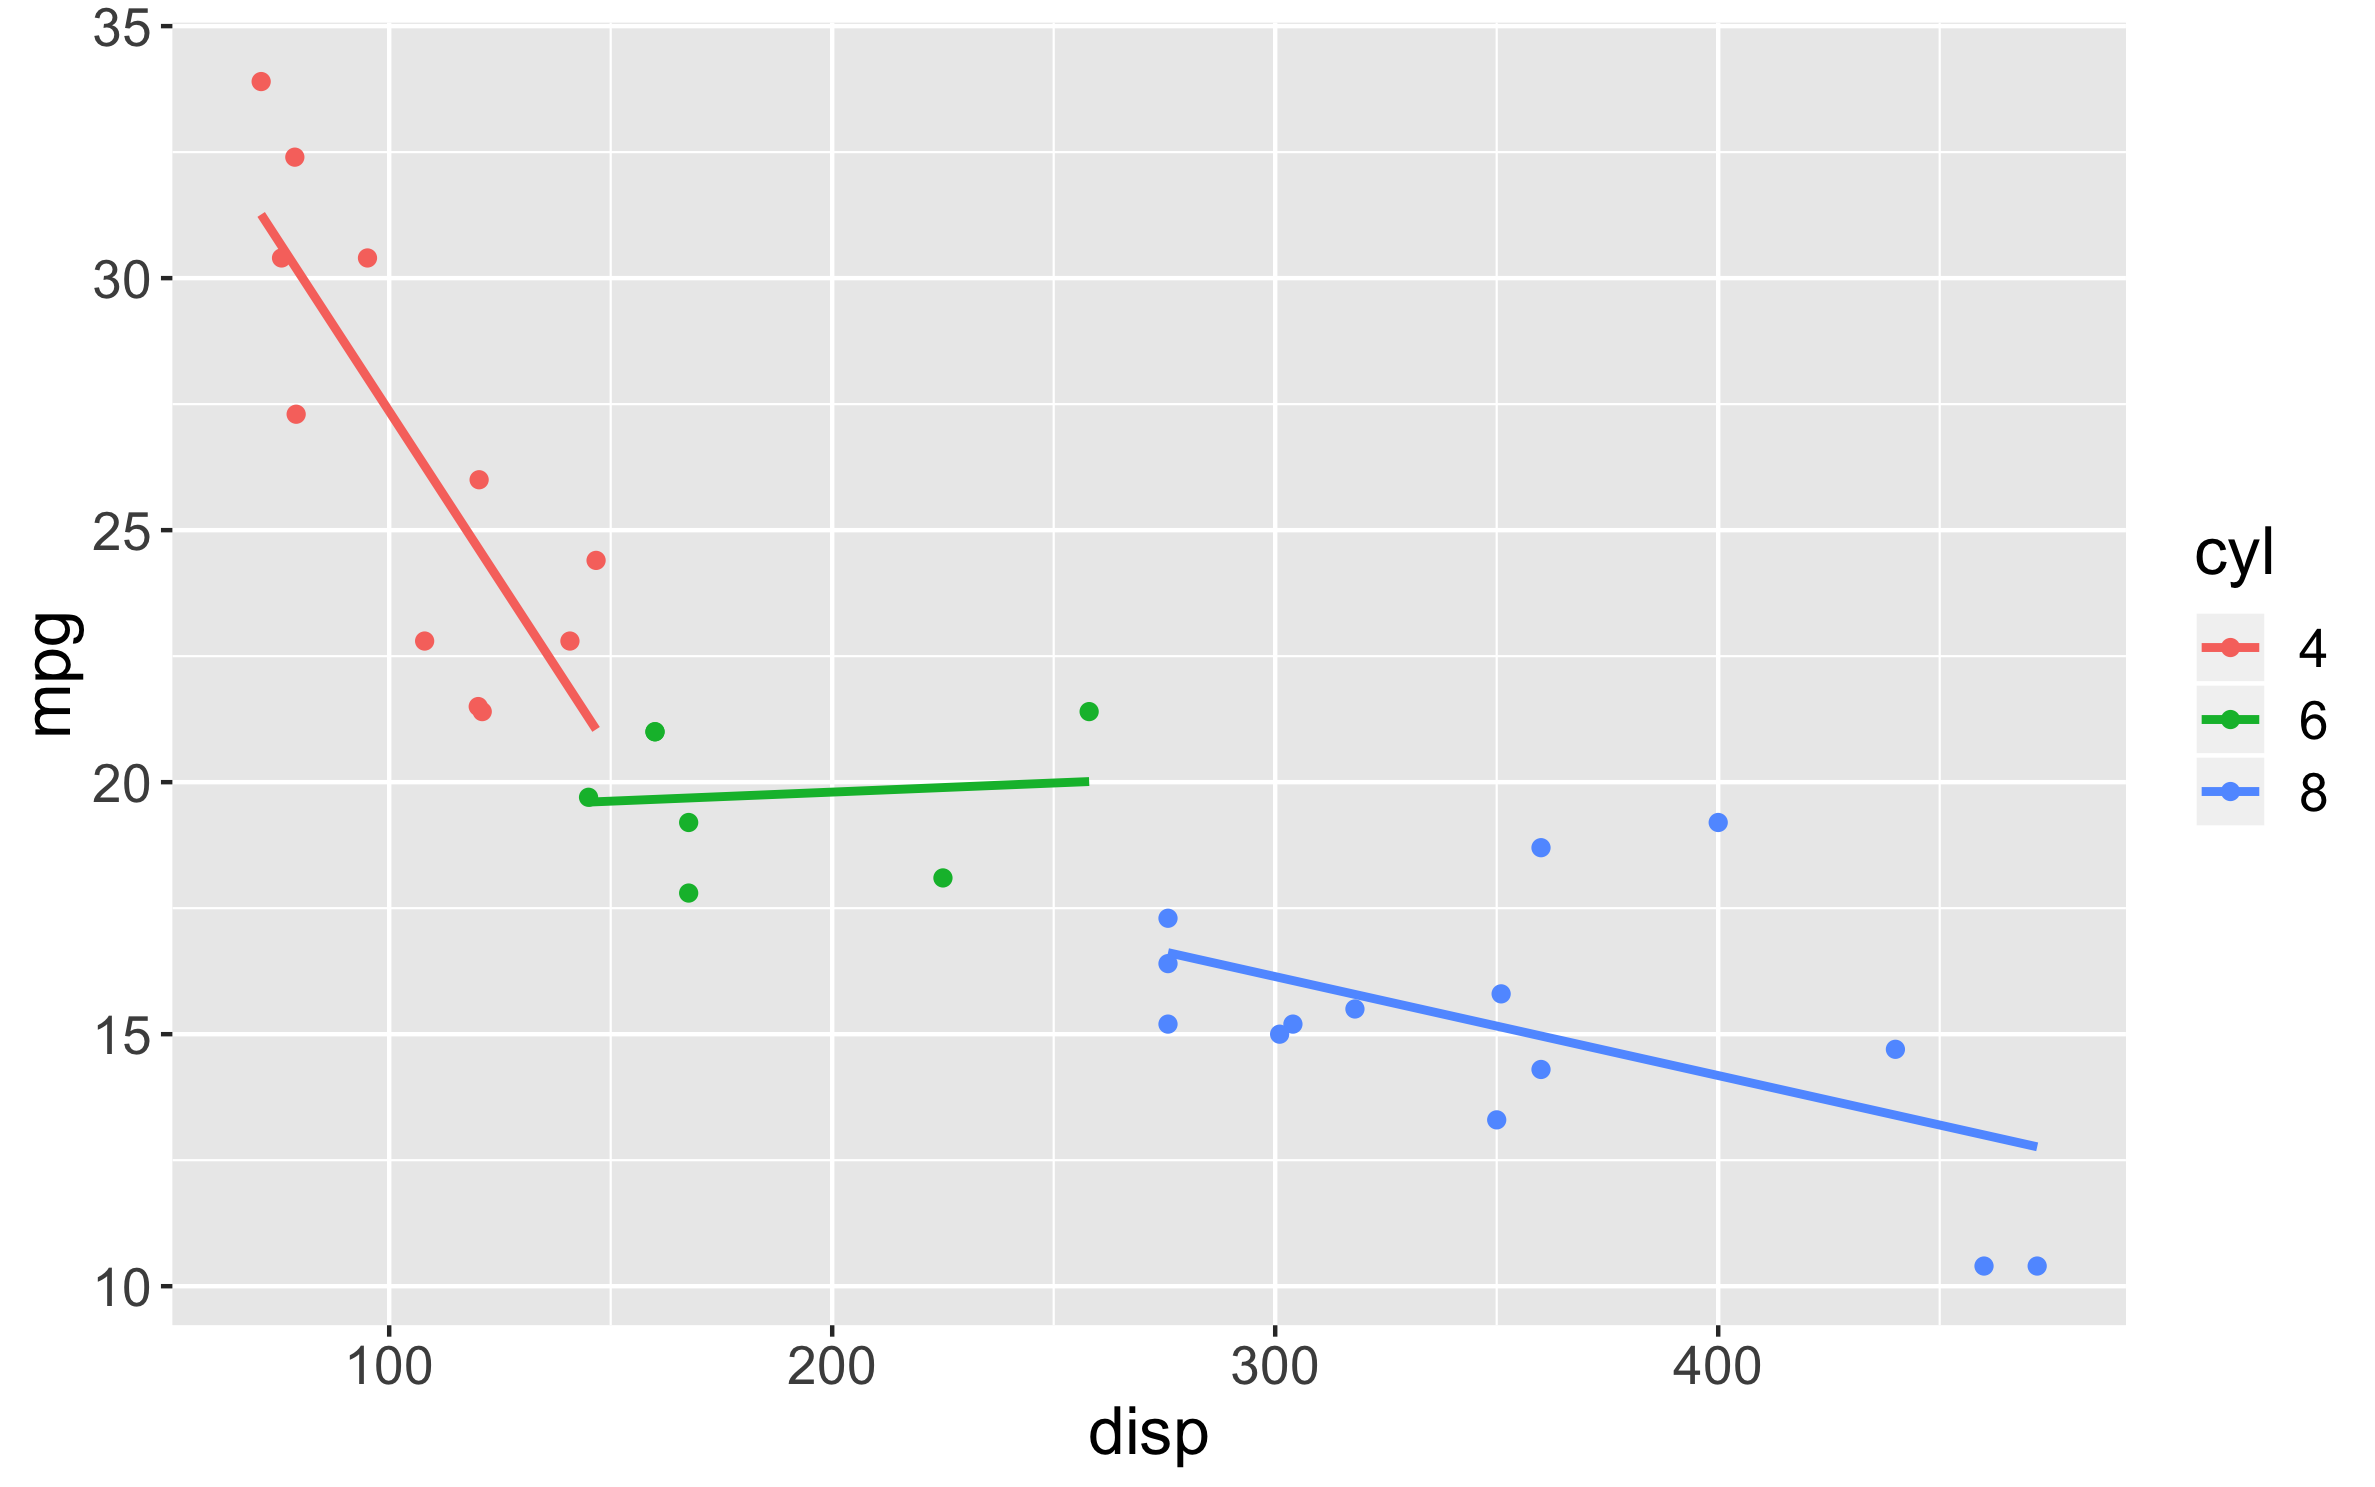
# Scatter plot with linear fit and no standard error (SE) bands
cql_str <- "CHART scatter X disp, cyl Y mpg Fit 'false'";
cql(dframe, cql_str);
Contact
For any feedback, bug reports or questions, please contact: [email protected]