:moneybag: A portable CPU profiler with ASCII,CSV,TSV,Markdown,chrome://tracing support (C++11)
Dollar 💰 
- [x] Generic instrumented CPU profiler (C++11)
- [x] Ascii results in plain text, Markdown, TSV and CSV formats.
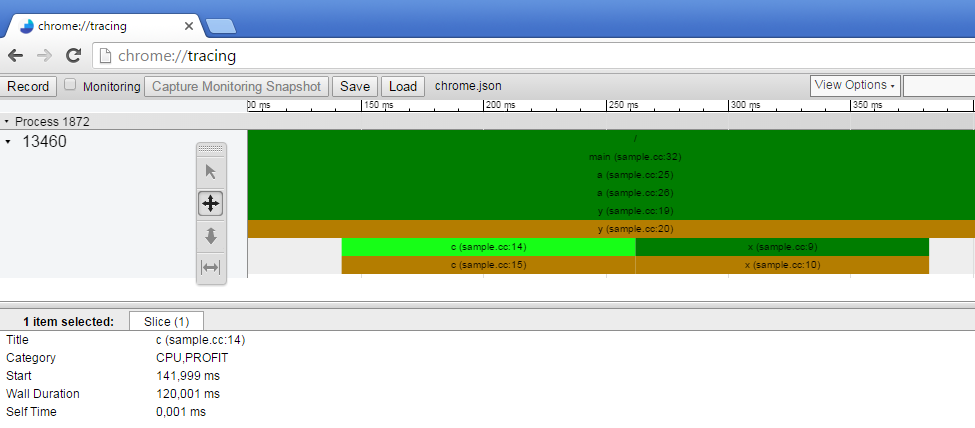
- [x] Compatible JSON traces for Chrome’s built-in trace viewer (chrome://tracing).
- [x] Tiny, self-contained, cross-platform, header-only.
- [x] ZLIB/libPNG licensed.
Quick tutorial (tl;dr)
#include "dollar.hpp" // dollar is enabled by default. compile with -D$= to disable any profiling
int main() { $ // <-- put a dollar after every curly brace to determinate cpu cost of the scope
    for( int x = 0; x < 10000000; ++x ) { $ // <-- functions or loops will apply too
        // slow stuff...
    }
    dollar::text(std::cout);                      // report stats to std::cout in text format; see also csv(), tsv() and markdown()
    dollar::chrome(std::ofstream("chrome.json")); // write tracing results to a json file (for chrome://tracing embedded profiler)
    dollar::clear();                              // clear all scopes (like when entering a new frame)
}
API
- Determinate the CPU cost of any scope by putting a
$dollar sign in front of it. - Or just insert an
dollar raii("name")object. - The predefined
$macro just adds function name, line and number to the RAII object name. - Use
dollar::text(ostream),dollar::csv(ostream),dollar::tsv(ostream)ordollar::markdown(ostream)to print a text report in any ostream object (likestd::cout). - Additionally, use
dollar::chrome(ostream)to write a chrome://tracing friendly json trace. - Finally, call
dollar::clear()when entering a new frame.
API: auto format tool
- @snail23 was generous enough to create this auto format tool that write dollars for you
Build options
- Dollar is enabled by default. Compile with
-D$=to disable it. - Define
DOLLAR_USE_OPENMPto use OpenMP timers (instead of<chrono>timers) - Define
DOLLAR_MAX_TRACESto change number of maximum instrumented samples (default: 512). - Define
DOLLAR_CPUMETER_WIDTHto change width of CPU meter bars (default: 10 characters).
Upcoming
- std::vector
(graph? opengl?) - “name %d” format
Showcase
~/dollar> cat ./sample.cc

#include <iostream>
#include <fstream>
#include <chrono>
#include <thread>
#include "dollar.hpp"

void x( int counter ) { $
    while( counter-- > 0 ) { $
        std::this_thread::sleep_for( std::chrono::microseconds( int(0.00125 * 1000000) ) );
    }
}
void c( int counter ) { $
    while( counter-- > 0 ) { $
        std::this_thread::sleep_for( std::chrono::microseconds( int(0.00125 * 1000000) ) );
    }
}
void y( int counter ) { $
    while( counter-- > 0 ) { $
        std::this_thread::sleep_for( std::chrono::microseconds( int(0.00125 * 1000000) ) );
        if( counter % 2 ) c(counter); else x(counter);
    }
}
void a( int counter ) { $
    while( counter-- > 0 ) { $
        std::this_thread::sleep_for( std::chrono::microseconds( int(0.00125 * 1000000) ) );
        y(counter);
    }
}

int main() { $
    a(10);

    // write tracing results to a json file (for chrome://tracing embedded profiler)
    std::ofstream file("chrome.json");
    dollar::chrome(file);

    // display results
    dollar::text(std::cout);

    // clear next frame
    dollar::clear();
}

~/dollar> g++ sample.cc -std=c++11 && ./a.out
   1.   +-main (./dollar.hpp:535)          [..........]  0.00% CPU (    0.000ms)     1 hits
   2.     +-a (./dollar.hpp:528)           [..........]  0.00% CPU (    0.000ms)     1 hits
   3.       +-a (./dollar.hpp:529)         [..........]  5.71% CPU (   20.000ms)    10 hits
   4.         +-y (./dollar.hpp:522)       [..........]  0.00% CPU (    0.000ms)    10 hits
   5.           +-y (./dollar.hpp:523)     [==........] 25.71% CPU (   90.000ms)    45 hits
   6.             |-c (./dollar.hpp:517)   [..........]  0.00% CPU (    0.000ms)    20 hits
   7.             | +-c (./dollar.hpp:518) [===.......] 34.29% CPU (  120.000ms)    60 hits
   8.             +-x (./dollar.hpp:512)   [..........]  0.00% CPU (    0.000ms)    25 hits
   9.               +-x (./dollar.hpp:513) [===.......] 34.29% CPU (  120.000ms)    60 hits

~/dollar> g++ sample.cc -std=c++11 -D$= && ./a.out
~/dollar>
Changelog
- v1.2.0 (2016/10/03): Add chrome://tracing profiler support; Project renamed
- v1.1.0 (2016/05/03): New tree view and CPU meters (ofxProfiler style); Smaller implementation;
- v1.0.1 (2015/11/15): Fix win32
max()macro conflict - v1.0.0 (2015/08/02): Macro renamed
- v0.0.0 (2015/03/13): Initial commit