Risk Network Modeling and Analysis
![]()
Features
- Create interactive risk network models
- Learn the structure of your network with structural learning algorithms
- Learn the paramaters of your network with effective paramater learning methods
- Measure the importance of connections in your network with node and network measures
- Generate data from your network and export to your favorite app
Overview
RiskNetwork is a Shiny web application for risk network modeling and analysis, powered by the excellent bnlearn package. While this app was developed specifically for risk networks, it can also be used for general Bayesian Network modeling and analysis.
Getting Started
To install RiskNetwork in R:
devtools::install_github('paulgovan/RiskNetwork')
To launch the app:
RiskNetwork::RiskNetwork()
Or to access the app through a browser, visit paulgovan.shinyapps.io/RiskNetwork.
Example
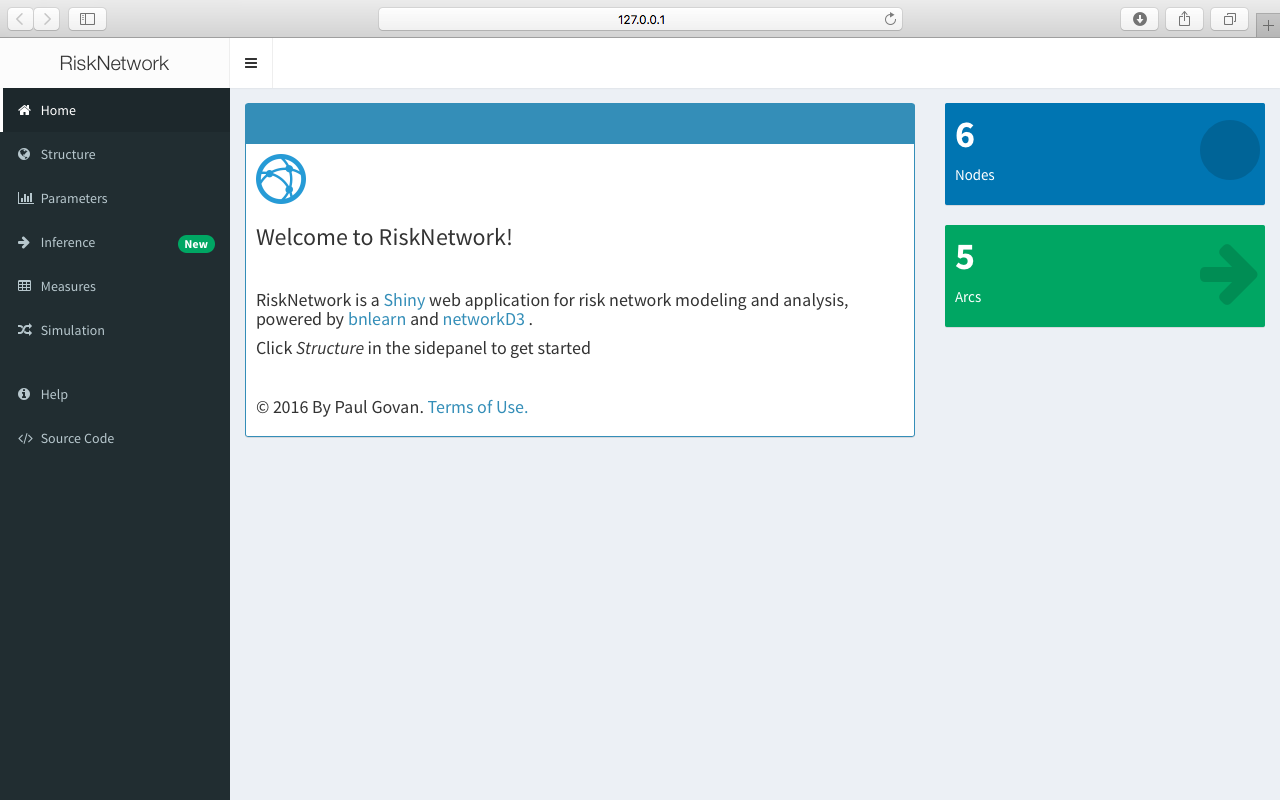
Home
Launching the app brings up the Home tab. The Home tab is basically a landing page that gives a brief introduction to the app and includes two value boxes, one each for the number of nodes and arcs in the network.
RiskNetwork comes with a number of simulated and “real world” data sets. This example will use the “Sample Discrete Network”, which is the selected network by default.
Structure
Click Structure in the sidepanel to begin learning the network from the data.
The Bayesian network is automatically displayed in the Risk Network box.
In order to learn the structure of a network for a given data set, upload the data set in csv format using The Network Input box. Again, this example uses the “Sample Discrete Network”, which should already be loaded.
Select a learning algorithm from the Structural Learning box. A number of different stuctural learning algorithms are currently supported, including:
- Constraint-based algorithms
- Score-based algorithms
- Hybrid-structure algorithms
- Local discovery algorithms
To view the network score, select a score function from the The Network Score box.
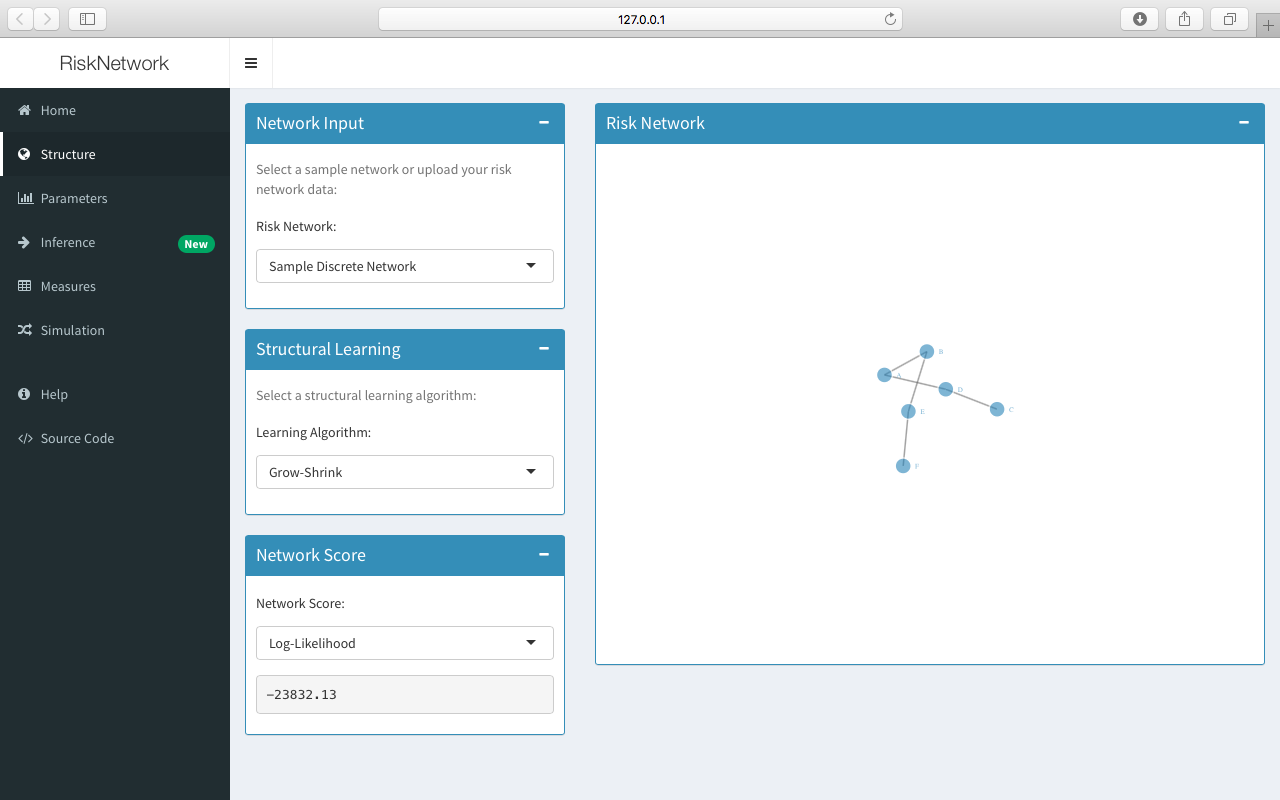
“Sample Discrete Network” contains six discrete variables, stored as factors with either 2 or 3 levels. The structure of this simple Bayesian network can be learned using the grow-shrink algorithm, which is the selected algorithm by default.
Try different combinations of structural learning algorithms and score functions in order to see the effect (if any) on the resulting network.
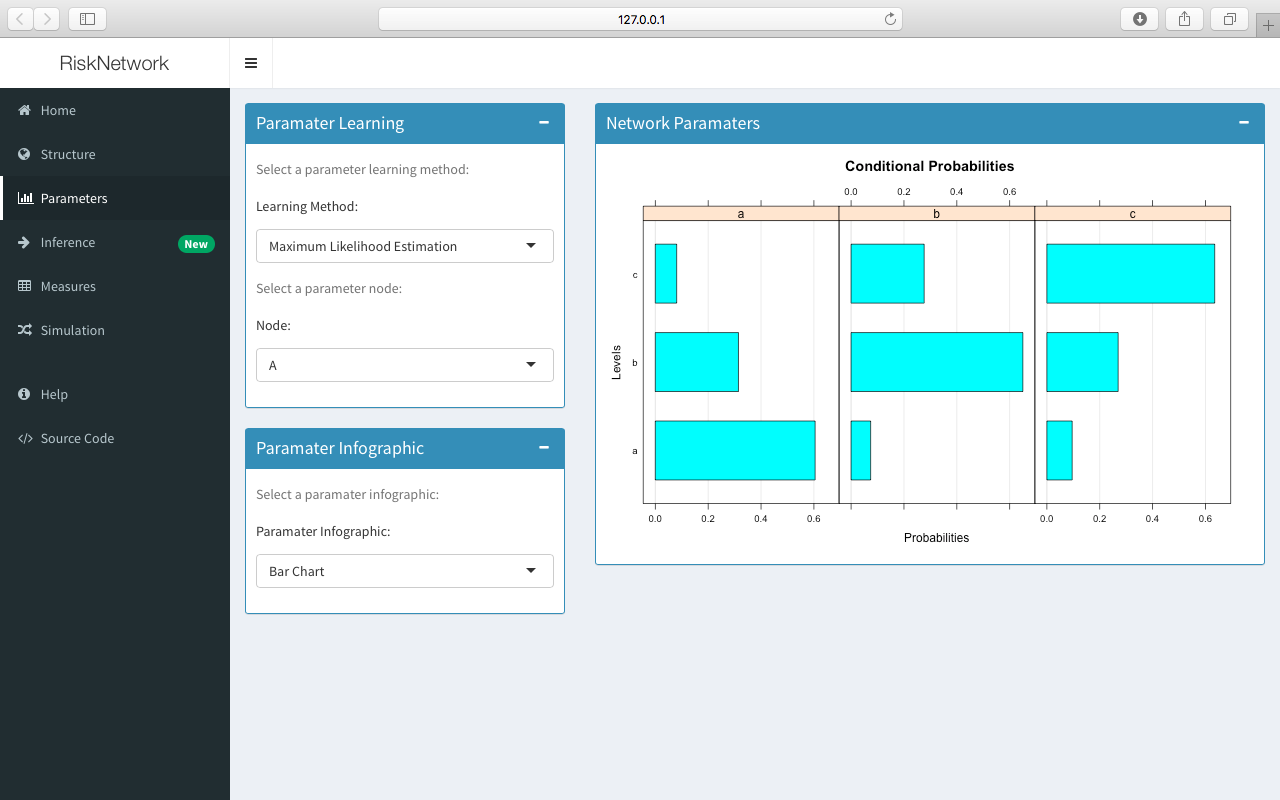
Parameters
Select the grow-shrink algorithm once again and then click Parameters in the sidepanel in order to learn the parameters of the network. The selected paramaters are automically displayed in the Network Paramaters box.
Select a learning algorithm from the Parameter Learning box. This app supports both maximum-likelihood and Bayesian estimation of the parameters. Note that Bayesian parameter learning is currently only implemented for discrete data sets. Then select the type of chart to display in the Paramter Infographic box and, for the discrete case, choose your preferred node. For example, the selected node A is a discrete node with three levels: a, b, and c.
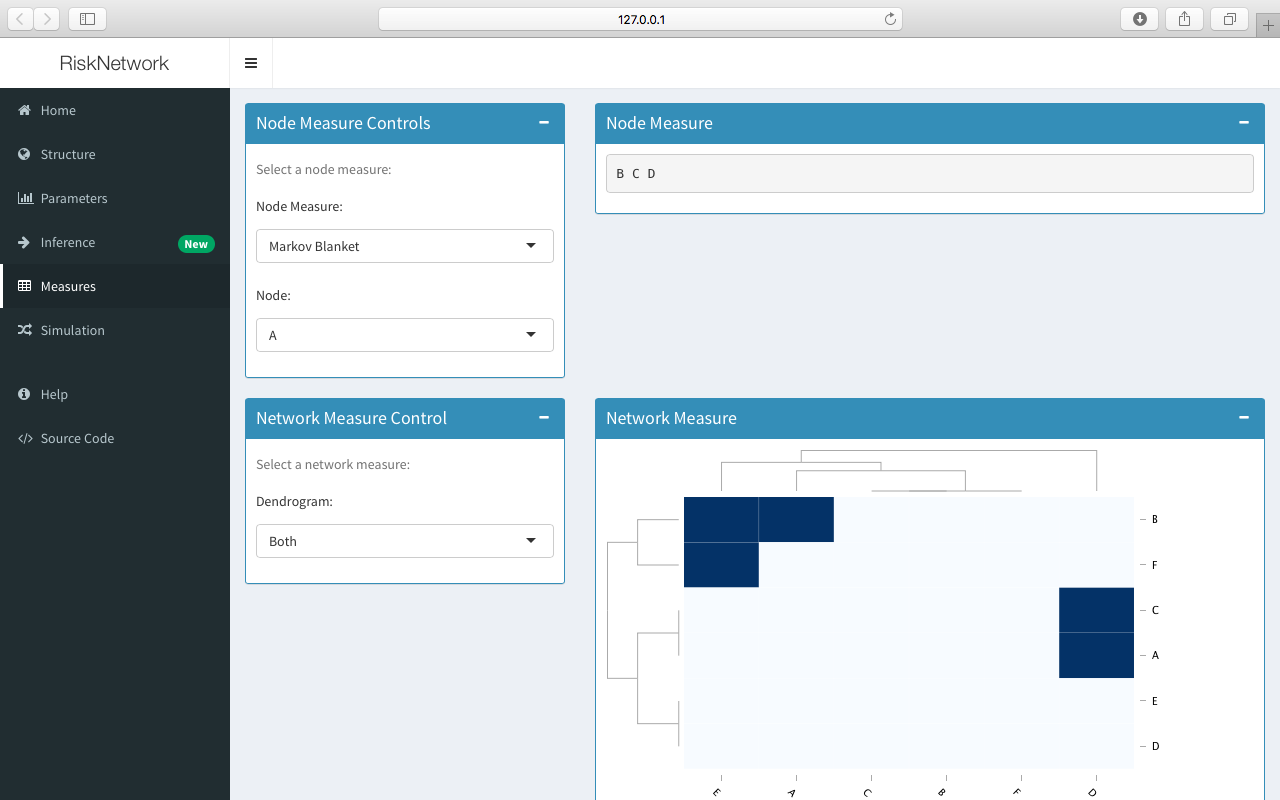
Measures
Click Measures in the sidepanel to bring up a number of tools for classical network analysis. The Measures tab has a number of node and network measures. The node measures include:
- Markov blanket
- Neighborhood
- Parents
- Children
- In degree
- Out degree
- Incident arcs
- Incoming arcs
- Outgoing arcs
Select a node measure in the Node Control box and the result will be displayed in the Node Measure box.
The Network Control box contains different options for hierarchical clustering of the network. Select the type of dendogram to display (row, column, both, or none) and the resulting dendogram(s) will be displayed along with the adjacency matrix in the Network Measure box.
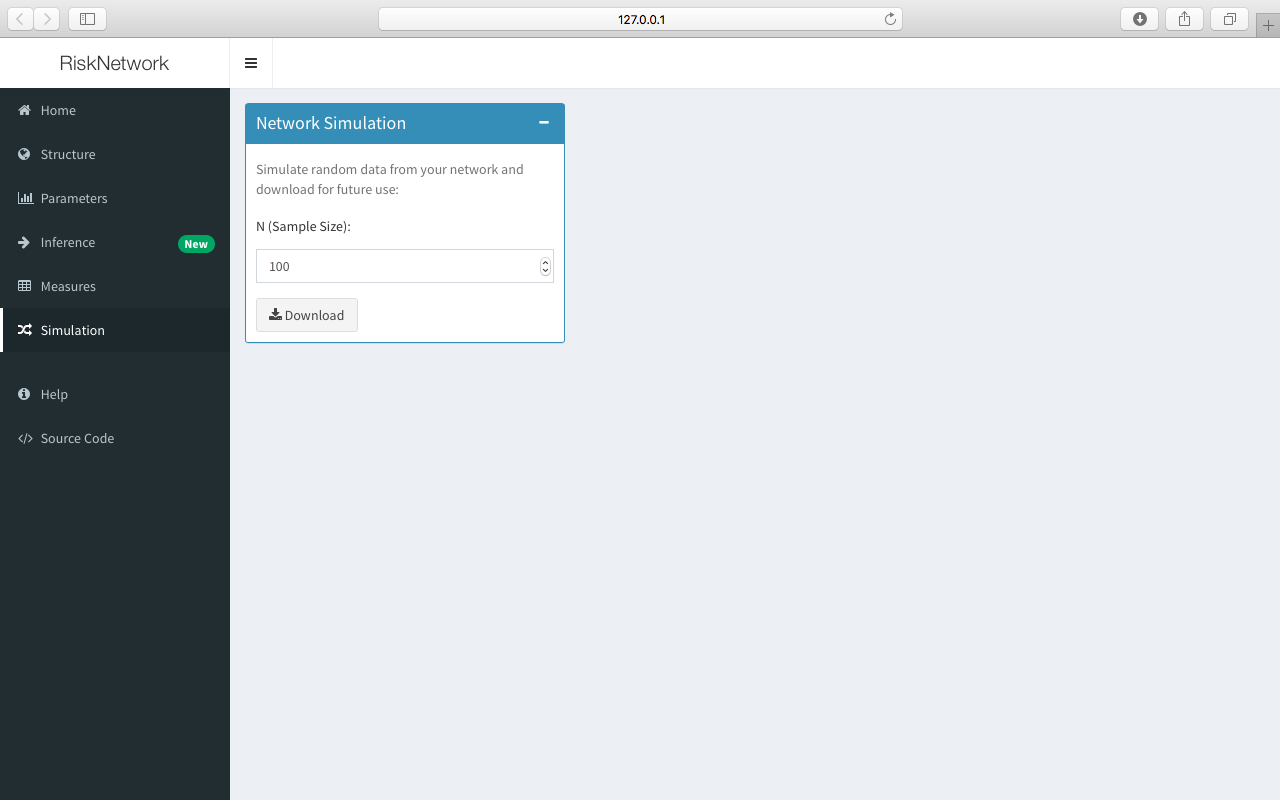
Simulation
Finally, click Simulation in the sidepanel in order to simulate data from the network for future use. Simply enter the sample size N in the Network Simulation box and click Download in order to download a random sample of data from the Bayesian network.