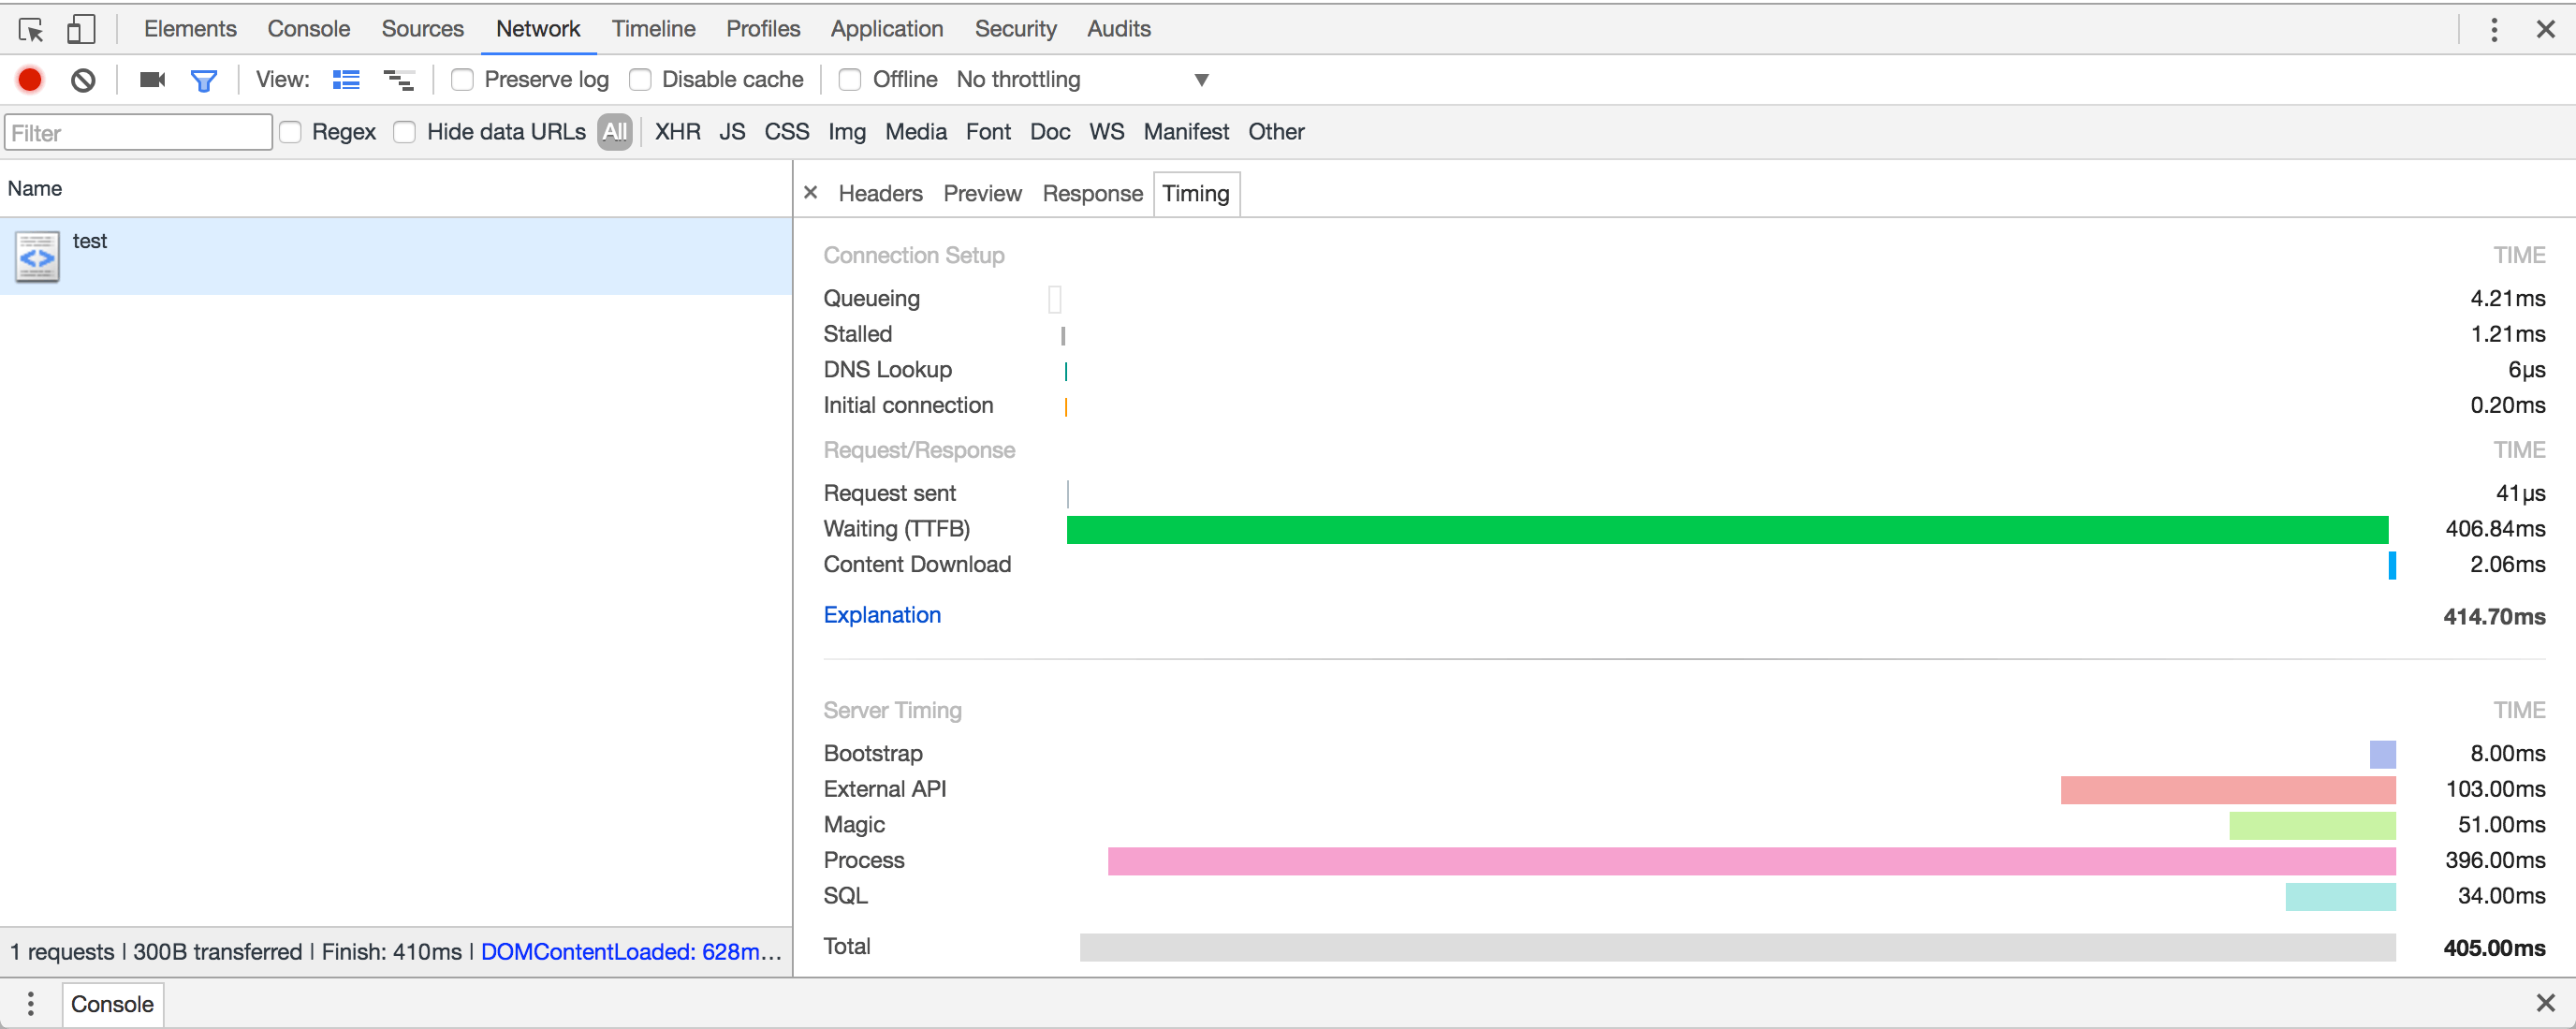
PSR-7 & PSR-15 middleware to add the Server-Timing header
PSR-7 and PSR-15 Server Timing Middleware
This middleware implements the Server-Timing header which can be used for displaying server side timing information on Chrome DevTools.

Install
Install using Composer:
$ composer require tuupola/server-timing-middleware
Simple usage
To get the default timings add the middleware to the pipeline. With Zend Expressive this goes go to the file named config/pipeline.php.
use Tuupola\Middleware\ServerTimingMiddleware;

$app->pipe(ServerTimingMiddleware::class);
Slim Framework does not have specific config files. Otherwise adding the middleware is similar with previous.
$app->add(new Tuupola\Middleware\ServerTimingMiddleware);
You should now see the default timings when doing a request.
Bootstrapis the time taken from start of the request to execution of the first incoming middlewareProcessis the time taken for server to generate the response and process the middleware stackTotalis the total time taken
$ curl --include http://localhost:8080

HTTP/1.1 200 OK
Server-Timing: Bootstrap;dur=54, Process;dur=2, Total;dur=58
Note that ServerTimingMiddleware must be added as last middleware. Otherwise timings will be inaccurate.
Changing the defaults
If you are not happy with the above you can change the description by using an optional settings array. To disable any of the defaults set the description to null.
use Tuupola\Middleware\ServerTimingMiddleware;
use Tuupola\Middleware\ServerTiming\Stopwatch;

$app->add(new ServerTimingMiddleware(
    new Stopwatch,
    [
        "bootstrap" => "Startup",
        "process" => null,
        "total" => "Sum"
    ])
);
$ curl --include http://localhost:8080

HTTP/1.1 200 OK
Server-Timing: Startup;dur=52, Sum;dur=57
Advanced usage
Example below uses Slim Framework. Note again that ServerTimingMiddleware must be added as last middleware. Otherwise timings will be inaccurate.
You can add your own timings by using the Stopwatch instance. See example below.
require __DIR__ . "/vendor/autoload.php";

use Psr\Http\Message\ServerRequestInterface as Request;
use Psr\Http\Message\ResponseInterface as Response;
use Tuupola\Middleware\ServerTimingMiddleware;
use Tuupola\Middleware\ServerTiming\Stopwatch;

$app = new Slim\App;
$container = $app->getContainer();

$container["stopwatch"] = function ($container) {
    return new Stopwatch;
};

$container["ServerTimingMiddleware"] = function ($container) {
    return new ServerTimingMiddleware($container["stopwatch"]);
};

$container["DummyMiddleware"] = function ($container) {
    return function ($request, $response, $next) {
        usleep(200000);
        return $next($request, $response);
    };
};

$app->add("DummyMiddleware");
$app->add("ServerTimingMiddleware");

$app->get("/test", function (Request $request, Response $response) {
    $this->stopwatch->start("External API");
    usleep(100000);
    $this->stopwatch->stop("External API");

    $this->stopwatch->closure("Magic", function () {
        usleep(50000);
    });

    $this->stopwatch->set("SQL", 34);

    return $response;
});

$app->run();
$ curl --include http://0.0.0.0:8080/test

HTTP/1.1 200 OK
Server-Timing: Bootstrap;dur=9, externalapi;dur=101;desc="External API", Magic;dur=50, SQL;dur=34, Process;dur=360, Total;dur=369
Usage with Doctrine DBAL
If you use Doctrine DBAL you can automate SQL query timings by using the provided QueryTimer. It implements the DBAL SQLLogger interface and can be used as standalone or in a LoggerChain. You must use the same Stopwatch instance with both QueryTimer and ServerTimingMiddleware middleware.
use Doctrine\DBAL\Logging\EchoSQLLogger;
use Doctrine\DBAL\Logging\LoggerChain;

use Tuupola\Middleware\ServerTiming\QueryTimer;
use Tuupola\Middleware\ServerTiming\Stopwatch;

$logger = new LoggerChain;
$echo = new EchoSQLLogger;
$stopwatch = new Stopwatch;
$timer = new QueryTimer($stopwatch);

$logger->addLogger($echo);
$logger->addLogger($timer);

/* Use your Doctrine DBAL connection here. */
$connection->getConfiguration()->setSQLLogger($logger);
Testing
You can run tests either manually or automatically on every code change. Automatic tests require entr to work.
$ make test
$ brew install entr
$ make watch
Contributing
Please see CONTRIBUTING for details.
Security
If you discover any security related issues, please email [email protected] instead of using the issue tracker.
License
The MIT License (MIT). Please see License File for more information.


