R Shiny application for interactive analysis of networks created by vosonSML.
VOSONDash - Shiny Dashboard App


![]()

VOSONDash is an interactive R Shiny web
application for the visualisation and analysis of social network data.
The app has a dashboard layout with sections for visualising and
manipulating network graphs, performing text analysis, displaying
network metrics and the collection of network data using the
vosonSML R package.
Installation Options
Install the most recent CRAN release:
install.packages("VOSONDash")
Install the most recent release tag via GitHub:
install.packages(
  "https://github.com/vosonlab/VOSONDash/releases/download/v0.5.11/VOSONDash-0.5.11.tar.gz",
  repo = NULL, type = "source")
Install the latest development version:
# library(remotes)
remotes::install_github("vosonlab/VOSONDash")
Once the VOSON Dashboard package is installed and loaded the Shiny web
application can be run from the RStudio console using the
runVOSONDash() function.
library(VOSONDash)
runVOSONDash()
Running the app for the first time
When run the VOSONDash app will check that all of the R packages that
are required to make it work are installed. It is likely that some
packages will be missing and the app will print a message indicating the
missing packages and a command that can be used to install them.
For example:
runVOSONDash()
# =================================================
# VOSONDash v0.6.1
# ...
# Checking packages...
#
# Error: Required packages missing.
# - shinyjs
# - visNetwork
#
# Please install required packages before using VOSONDash:
# install.packages(c("shinyjs", "visNetwork"))
The missing packages can be installed using the above install.packages
command.
After installing required packages and running again the VOSONDash
Shiny app will open up in the default web browser.
VOSON Dashboard
VOSONDash features an intuitive web interface with a section for
‘Analysis’ of graph data loaded from igraph
objects and a section for the ‘Collection’ of social media data using
vosonSML.
Analysis
Network and text analysis of graph data.
- Network Graphs: Visualise and modify networks
- Network Metrics: Calculate node and network level metrics
- Text Analysis: Word frequency, word clouds and sentiment
- Assortativity: Calculate homogeneity and homophily indexes (if VOSON
categorical node attributes present)
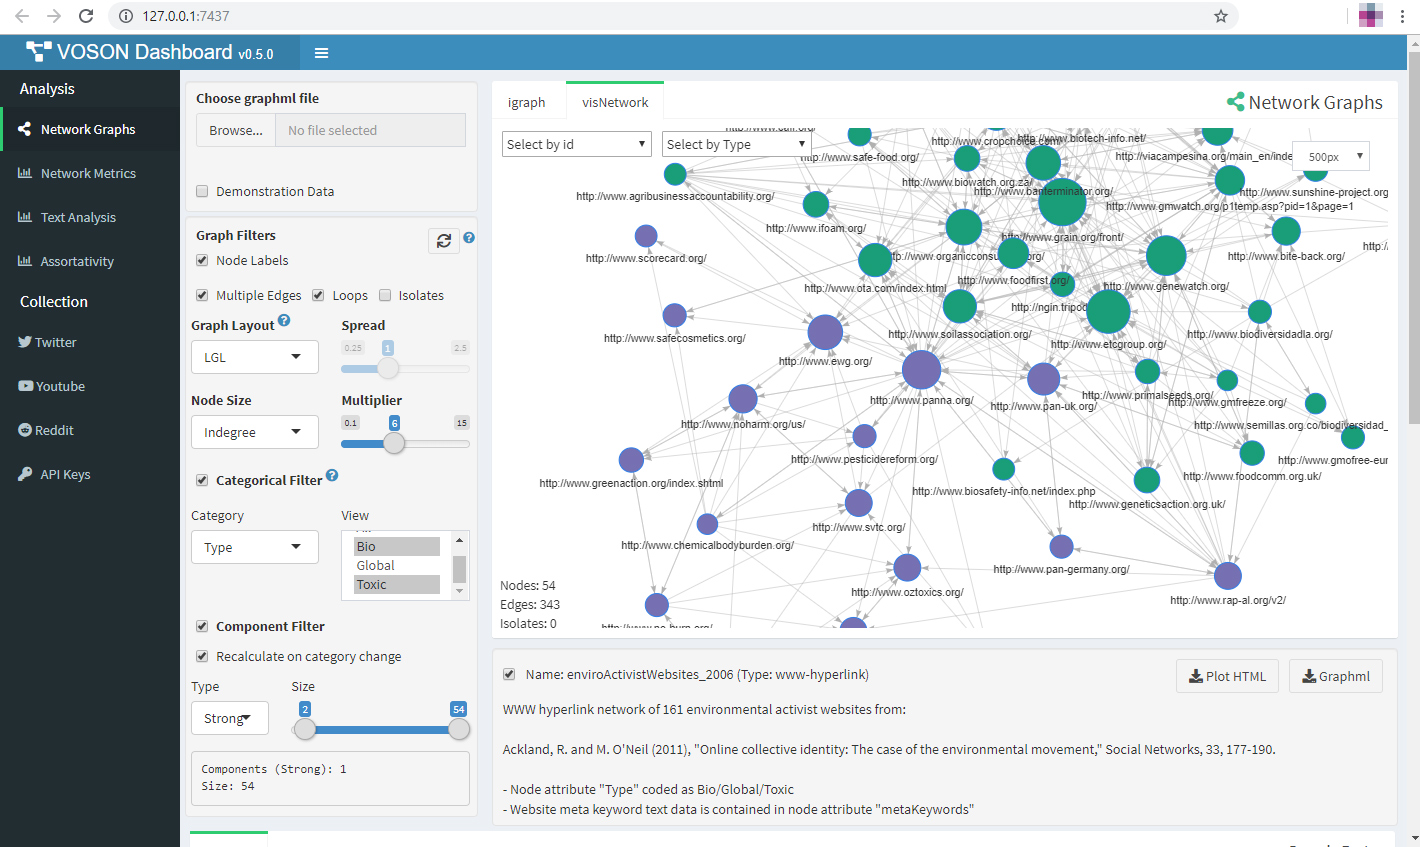
Figure 1. Environmental activist site hyperlink network loaded from a
graphml file and plotted by the visNetwork package.
Collection and Network Creation
Graphical interfaces for collecting network data from social media
API’s.
- Collect: Twitter, youtube and reddit network data
- Create: different types of networks from the data such as activity,
actor, twomode and semantic networks
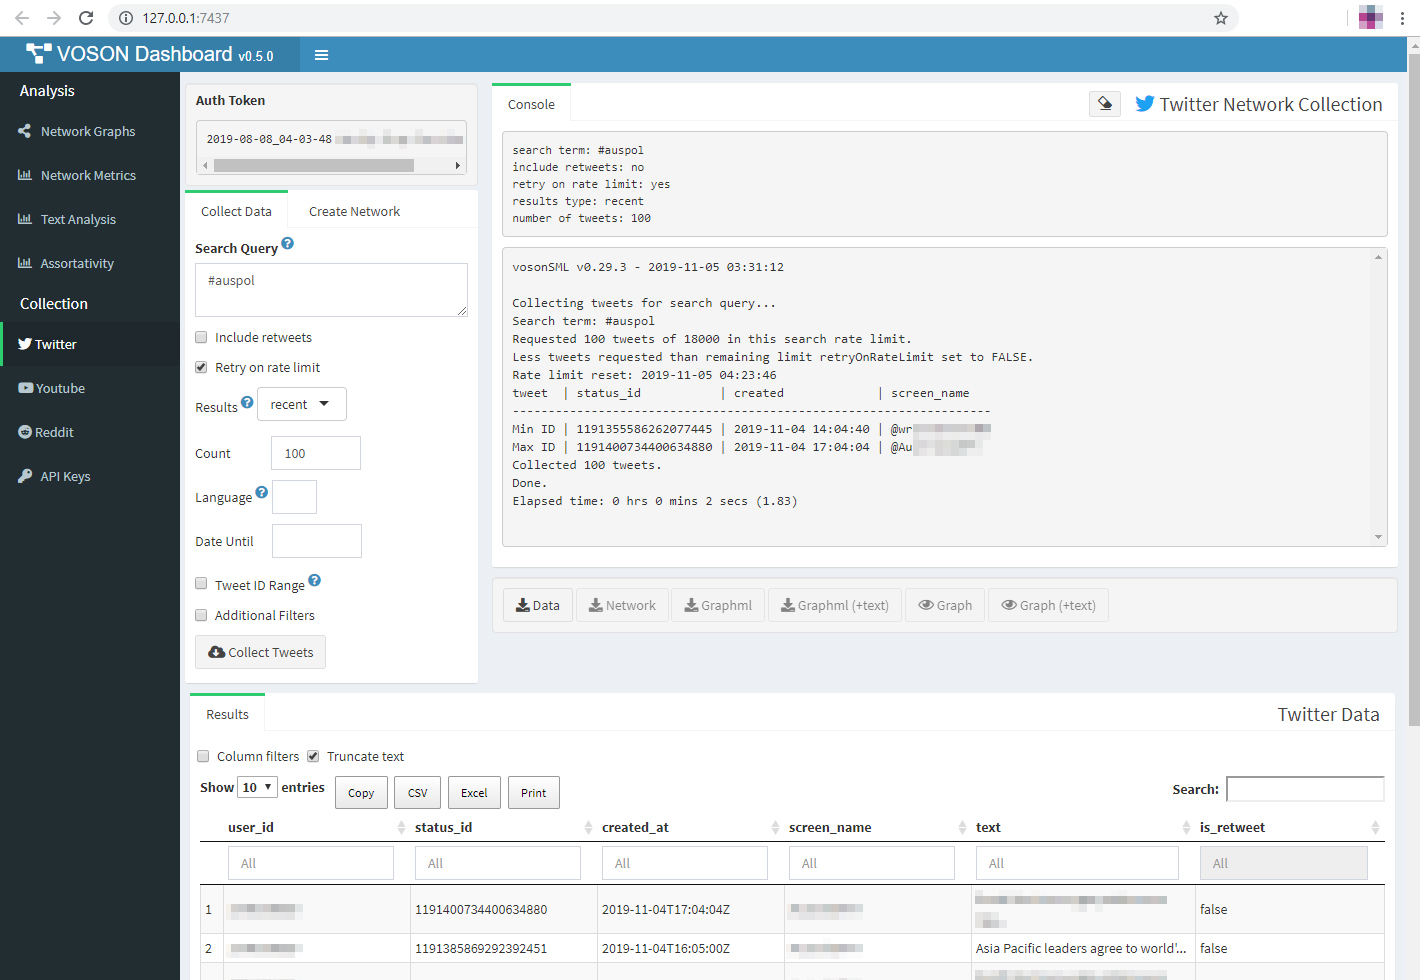
Figure 2. Collection of recent #auspol tweets and generation of an
actor network with the vosonSML package.
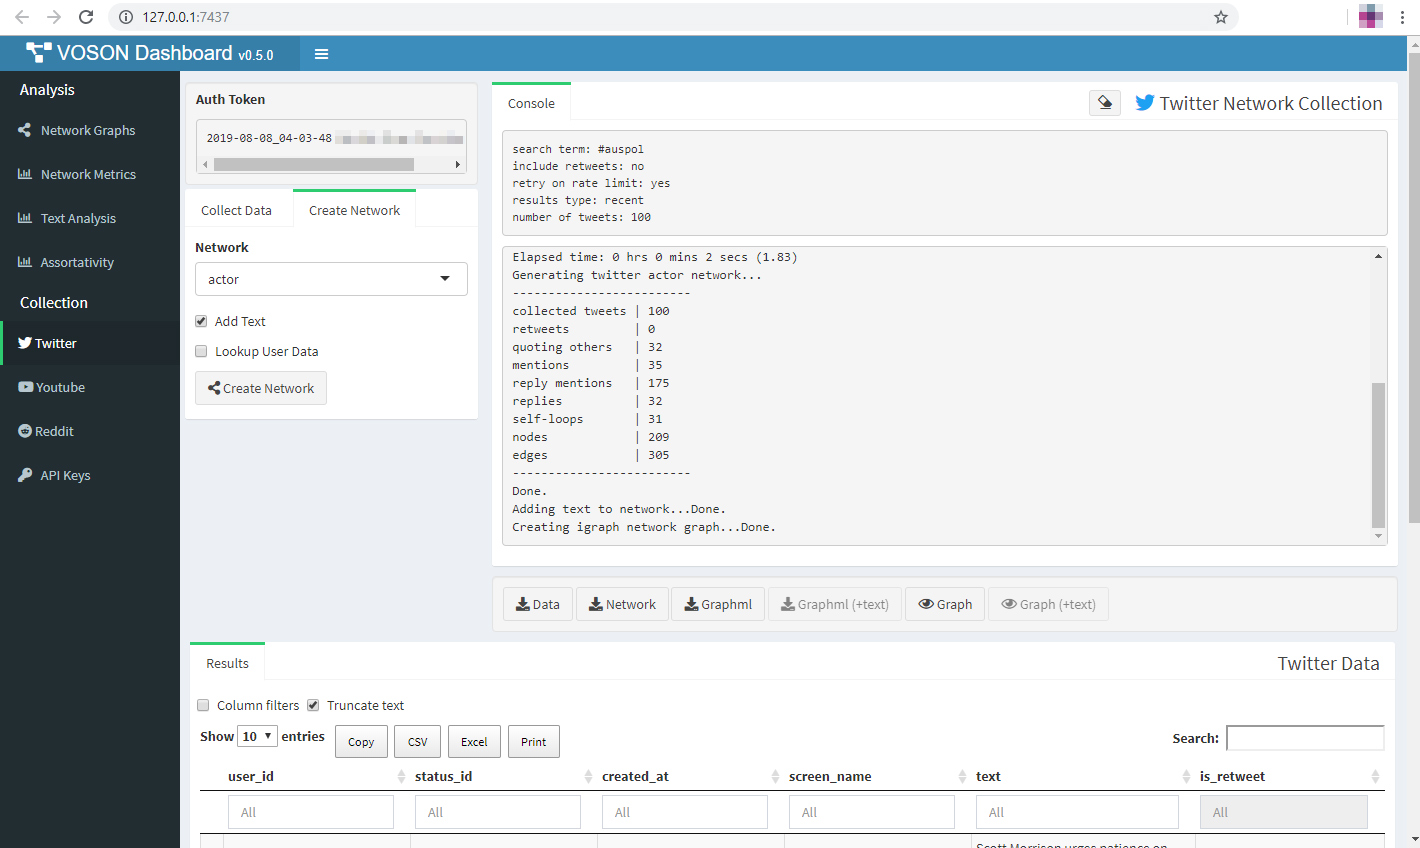
Figure 3. Create an actor network and add tweet text to the network.
API Keys and Tokens
- API Keys: Enter, save, load API keys and create access tokens
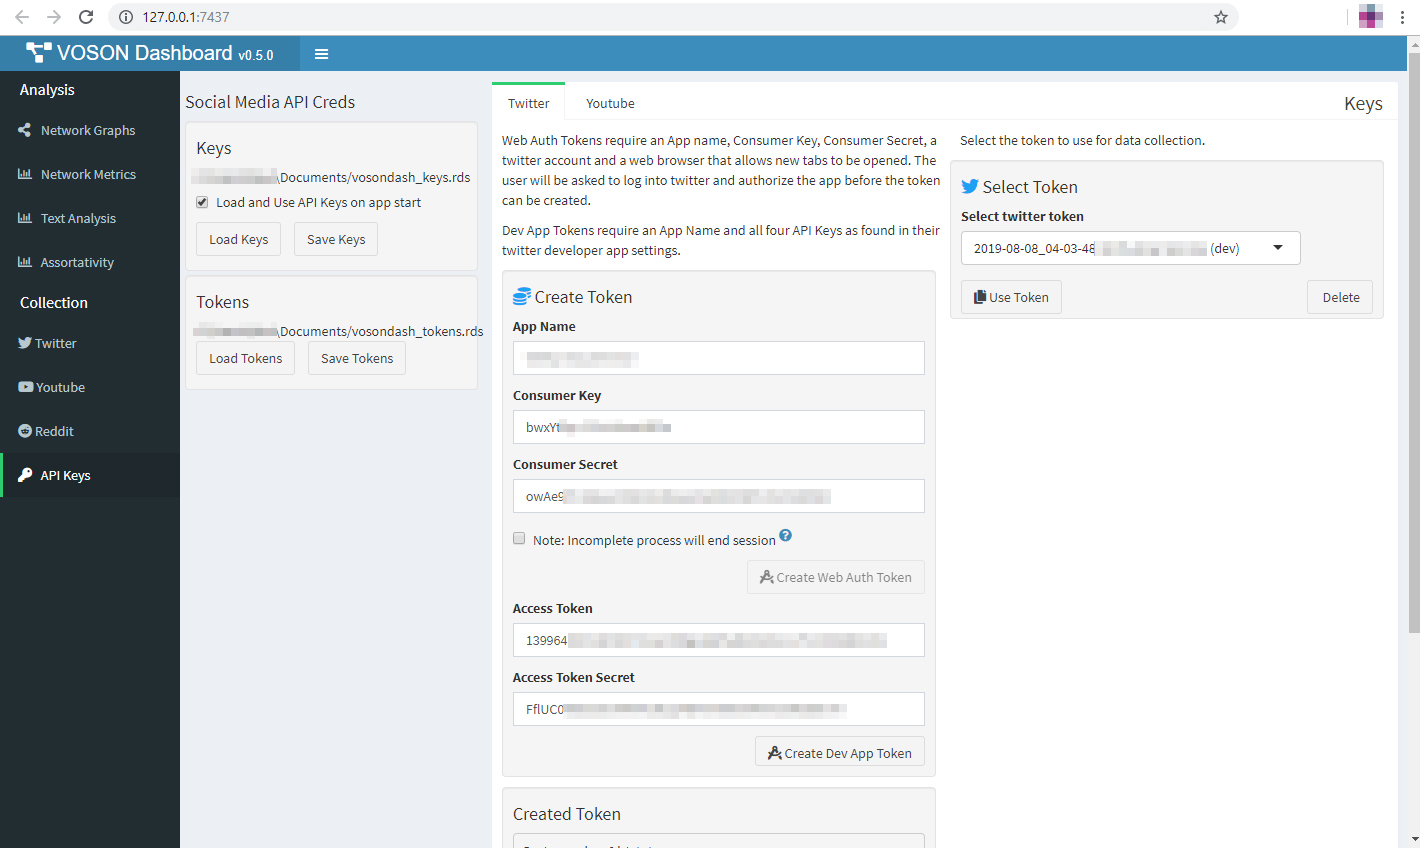
Figure 4. Twitter API token creation and selection.
Special thanks
This application would not be possible without key packages by other
authors in the R community, particularly the
shiny,
shinydashboard,
DT and
shinyjs packages. Graph
visualisations created with igraph
and visNetwork, and text
analysis with support from tm,
SnowballC,
wordcloud and
syuzhet packages.
Code of Conduct
Please note that the VOSON Lab projects are released with a Contributor
Code of
Conduct.
By contributing to this project, you agree to abide by its terms.