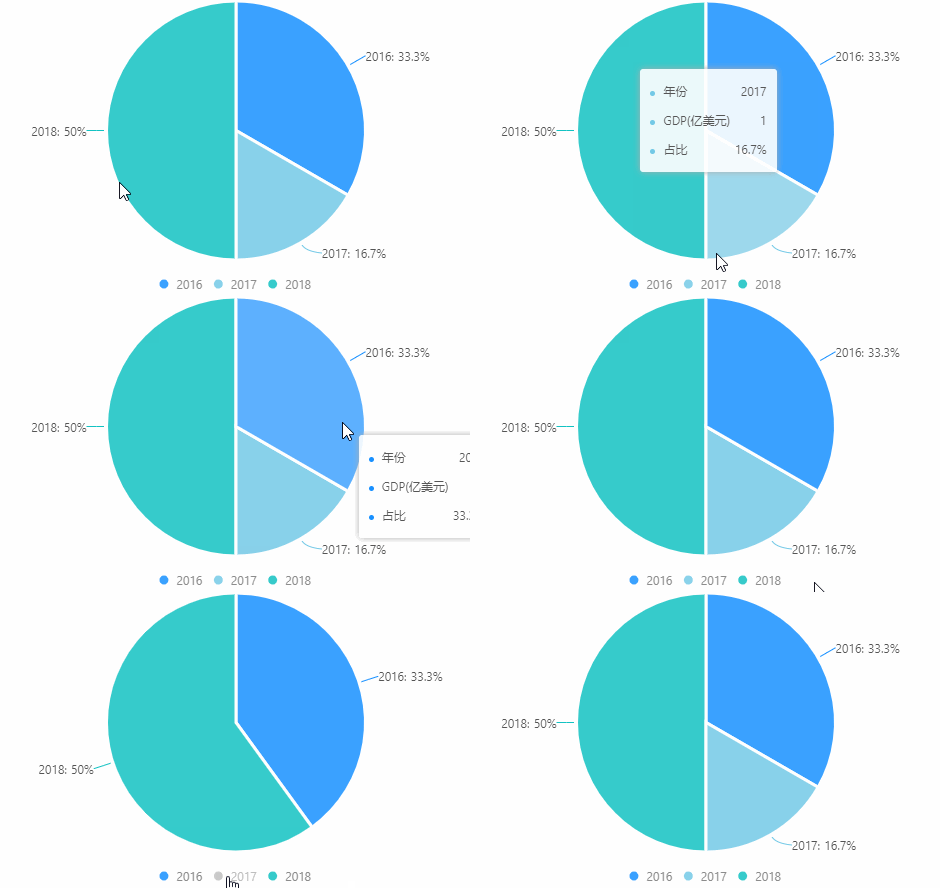
基于 Vue 和 AntV/G2 的可视化组件库 :chart_with_upwards_trend:
在vue-cli中使用
1.安装依赖
可以通过 npm 添加依赖
npm i @antv/[email protected] @antv/[email protected] vue-g2 --save
或者通过 yarn 添加依赖
yarn add @antv/[email protected] @antv/[email protected] vue-g2
2.引入依赖
在 main.js 中写入以下内容:
import Vue from 'vue'
import 'vue-g2'
import App from './App.vue'

Vue.config.productionTip = false

new Vue({
  render: h => h(App)
}).$mount('#app')
以上代码便完成了 vue-g2 的引入。
3.Vue组件中使用
在需要使用可视化图表的vue组件中通过 html 标签的形式使用, 如:
<template>
  <g2-pie type="pie"
    :axis-name="{ name: '年份', value: 'GDP(亿美元)' }"
    :data="data"
    :label-option="{ show: true, offset: 20 }">
  </g2-pie>
</template>

<script>
export default {
  data () {
    return {
      data: [
        { name: '2016', value: 2 },
        { name: '2017', value: 1 },
        { name: '2018', value: 3 }
      ]
    }
  }
}
</script>

<style>
</style>

在nuxt.js(ssr)中使用
1.安装依赖
可以通过 npm 添加依赖
npm i @antv/[email protected] @antv/[email protected] vue-g2 --save
或者通过 yarn 添加依赖
yarn add @antv/[email protected] @antv/[email protected] vue-g2
2.新建插件
在 plugins 文件夹中新建 vue-g2.client.js 文件,并写入以下内容:
import 'vue-g2'
3.引入插件
将插件引入nuxt.config.js
  plugins: [
    { src: '~/plugins/vue-g2.client' }
  ]
4.Vue组件中使用
在需要使用可视化图表的vue组件中通过 html 标签的形式使用, 如:
<template>
  <g2-pie type="pie"
    :axis-name="{ name: '年份', value: 'GDP(亿美元)' }"
    :data="data"
    :label-option="{ show: true, offset: 20 }">
  </g2-pie>
</template>

<script>
export default {
  data () {
    return {
      data: [
        { name: '2016', value: 2 },
        { name: '2017', value: 1 },
        { name: '2018', value: 3 }
      ]
    }
  }
}
</script>

在浏览器中直接使用
目前可以通过http://unpkg.com/vue-g2获取最新版本,也可通过http://unpkg.com/[email protected]/lib/vue-g2.umd.js获取指定版本。在页面上引入 js 即可开始使用。(需要引入vue、g2、data-set等前置依赖)
<!DOCTYPE html>
<html lang="en">
<head>
  <meta charset="UTF-8">
  <meta name="viewport" content="width=device-width, initial-scale=1.0">
  <meta http-equiv="X-UA-Compatible" content="ie=edge">
  <title>通过CDN使用vue-g2</title>
</head>
<body>
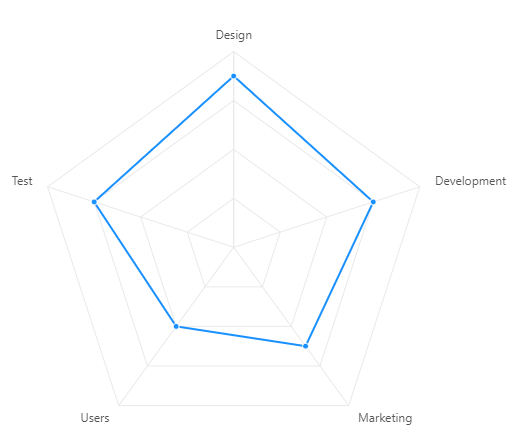
  <!-- 使用雷达图组件 -->
  <div id="example">
    <g2-radar
     style="width: 500px; height: 500px; margin: 0 auto;"
     :is-show-area="false"
     :show-legend="false"
     :axis-name="{a:'companya'}"
     :data="[{item: 'Design',a: 70},{item: 'Development',a: 60},
      {item: 'Marketing',a: 50},{item: 'Users',a: 40},
      {item: 'Test',a: 60}]">
    </g2-radar>
  </div>
  <!-- CDN方式引入 vue -->
  <script src="//unpkg.com/vue"></script>
  <!-- CDN方式引入 @antv/g2 -->
  <script src="//unpkg.com/@antv/[email protected]/build/g2.js"></script>
  <!-- CDN方式引入 @antv/data-set -->
  <script src="//unpkg.com/@antv/[email protected]/build/data-set.js"></script>
  <!-- CDN方式引入 vue-g2 -->
  <script src="//unpkg.com/vue-g2/lib/vue-g2.umd.js"></script>
  <script>
    new Vue({
      el: '#example'
    })
  </script>
</body>
</html>


